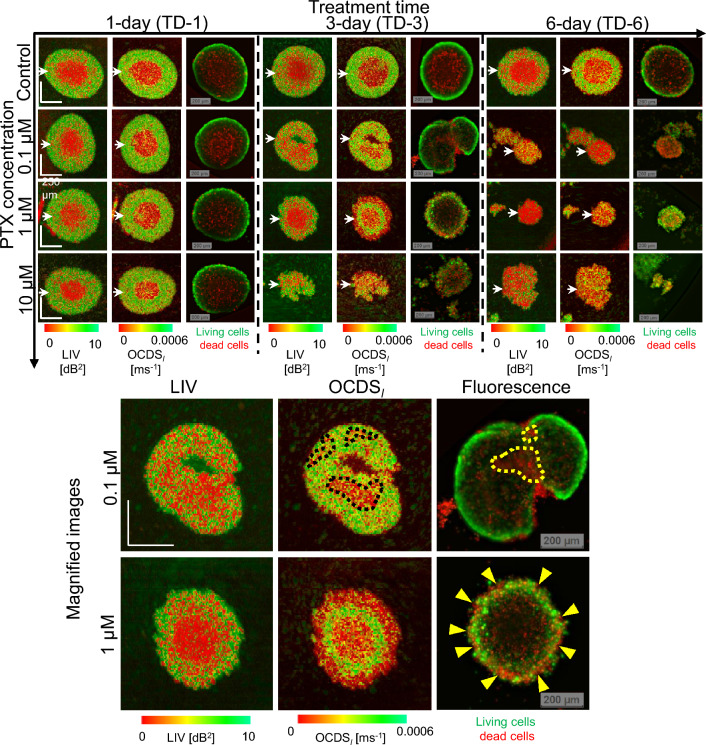
Figure 1.
LIV, OCDS, and fluorescence images of MCF-7 spheroid treated with PTX. The images are en face slices at around the center of the spheroids. The B-scan cross-sections and the intensity OCT images are available in the Supplementary materials (as Fig. S2 and Fig. S1, respectively.) Although the difference between the control sample and the PTX-treated samples is not obvious with the 1-day treatment, the 3- and 6-day-treated spheroids showed significantly different appearances to the control sample. The appearances of the fluorescence images are almost consistent with those of the LIV and OCDS images. The upper row of magnified images shows spheroid treated with 0.1-μM PTX, while the lower row shows one treated with 1-M PTX. The treatment time in both cases is 3 days. The appearance of the fluorescence images is more consistent with the OCDS images than LIV images. The scale bars represent 200 μm.

