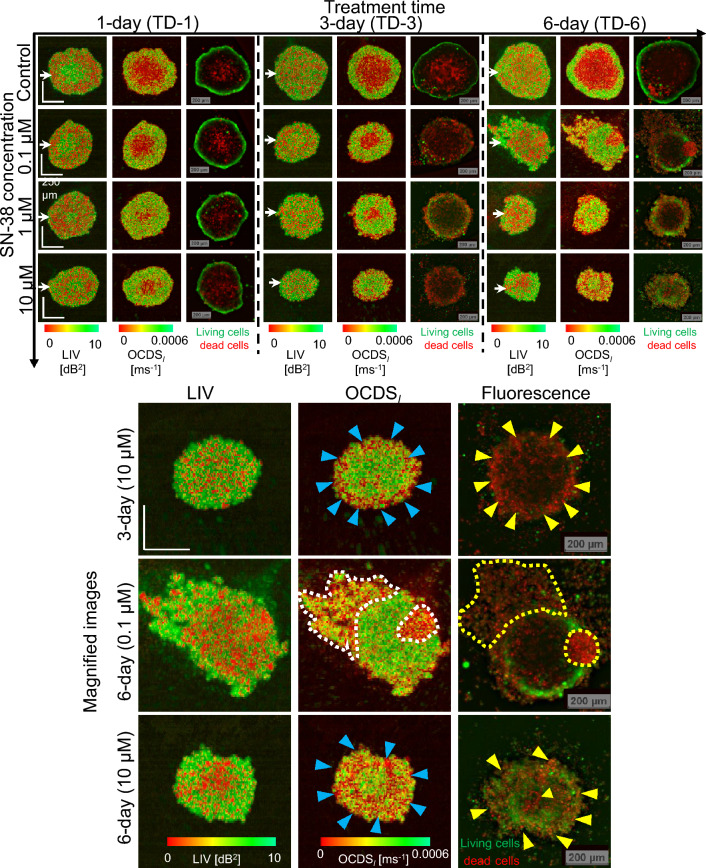
Figure 3.
En face LIV, OCDS, and fluorescence images of an HT-29 spheroid treated with SN-38. The LIV and OCDS patterns are very different to those for MCF-7 when treated with PTX (Fig. 1). Specifically, the LIV images of the TD-1 spheroids show high LIV (green) at the center surrounded by low LIV (red). After longer treatment times, the LIV images show a granular appearance. The OCDS images show concentric domain structures. In addition, the OCDS and fluorescence images are found to be highly correlated. Magnified images of HT-29 spheroids with sever volume reduction and shape corruption. High levels of pattern correlation between the OCDS and fluorescence patterns are observed. The scale bars represent 200 μm.

