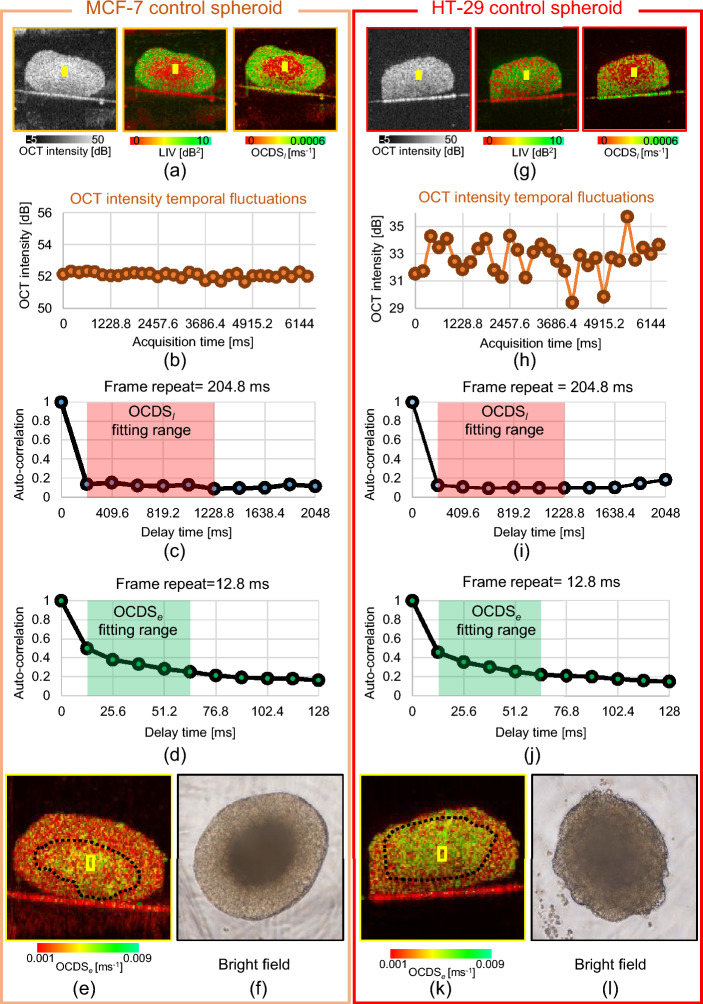
Figure 6.
Detailed analysis of apparent pattern differences between the control MCF-7 (left) and HT-29 (right) spheroids. (a), (g) Cross-sections of the OCT intensity, LIV, and OCDS. (b), (h) Time course of the OCT intensity in the core areas of the spheroids (as indicated by the yellow boxes). MCF-7 shows very low fluctuations, while HT-29 shows high levels of fluctuation. (c), (i) Auto-correlation curves for both spheroids, showing rapid decay as the auto-correlation became very low at the first sampling point of the delay time (204.8 ms). (d), (j) The autocorrelation curves with high temporal density show details of the autocorrelation decay at short correlation delay time. (e), (k) OCDS cross-sections of the same spheroids, showing the fast decay (green) at the center parts of the spheroid. These OCDS images were computed from a cross-sectional frame sequence of 350 frames acquired at a single location. (f), (l) Bright-field microscopy images of the spheroids, which show the necrotic cores as dark central region.

