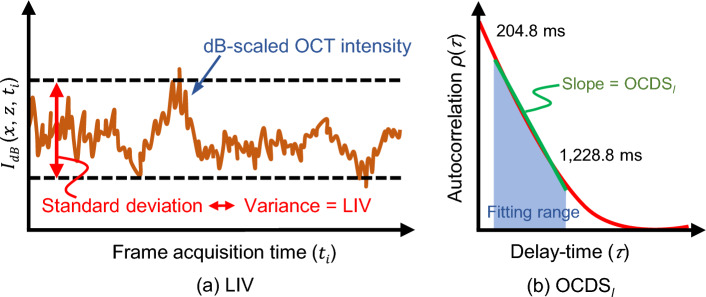
Figure 8.
Schematic depictions of two D-OCT algorithms:(a) LIV and (b) OCDS. LIV is defined as the temporal fluctuation (variance) of the dB-scaled OCT intensity. As a result, LIV is expected to be sensitive to the magnitude of the tissue dynamics. On the other hand, OCDS represents the speed of the dynamics and is defined as the decorrelation rate, i.e., as the slope of the auto-correlation curve [red curve in (b)] of the dB-scaled OCT intensity. The slope is computed here by performing a linear regression of the auto-correlation curve over a specified delay-time range [204.8, 1,228.8 ms].

