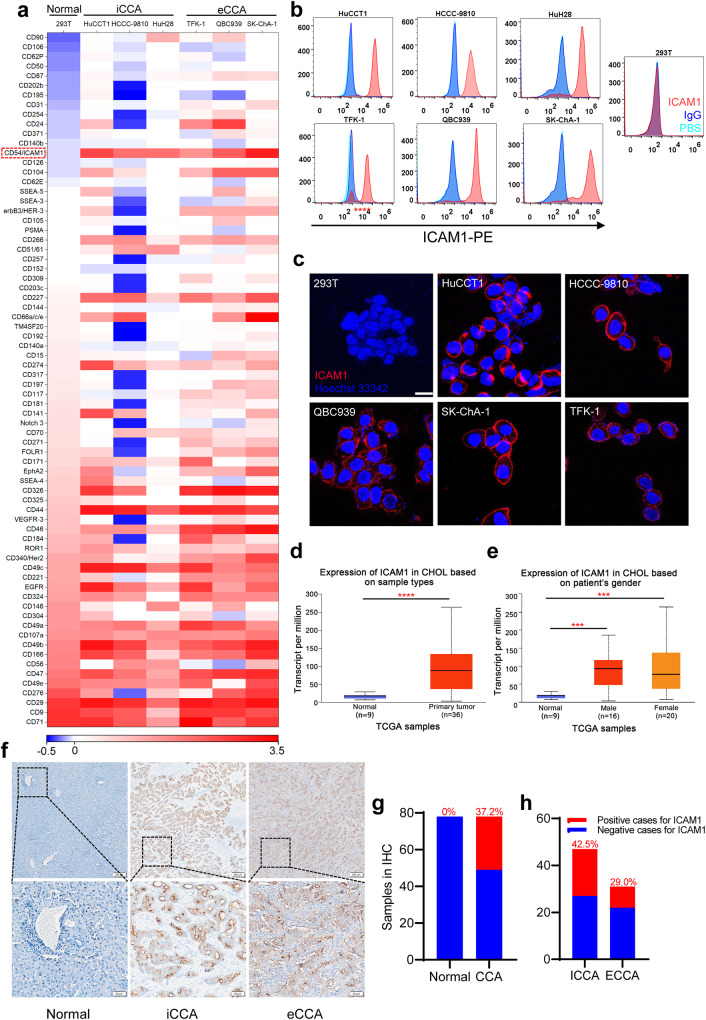
Fig. 1. Differential overexpression of ICAM1 in human CCA.
a Heatmap of membrane proteins expression in six human CCA cell lines and normal 293T cells. b Flow cytometry analysis of cell membrane expression levels of ICAM1 in six CCA cell lines and normal 293T cells. c IF staining of ICAM1 in human CCA and normal 293T cells. Scale bar, 20 µm. d, e ICAM1 mRNA expression levels of human CCA tumor tissues and normal bile duct tissues in TCGA samples acquired from UALCAN website. Error bars, SD. Unpaired t-test, ***P < 0.001, ****P < 0.0001. Median, quartiles, minimum, and maximum values are represented by the central line, limits of box, and ends of lines of boxplots shown. f Representative images of IHC staining of ICAM1 in human CCA tumor tissues (iCCA and eCCA) and normal bile duct tissues. Scale bar, 200 µm. g ICAM1 positive proportion in tumor and adjacent normal tissues in CCA patients (N = 78). h ICAM1 positive proportion in tumor tissues of iCCA (N = 47) and eCCA (N = 31) patients.

