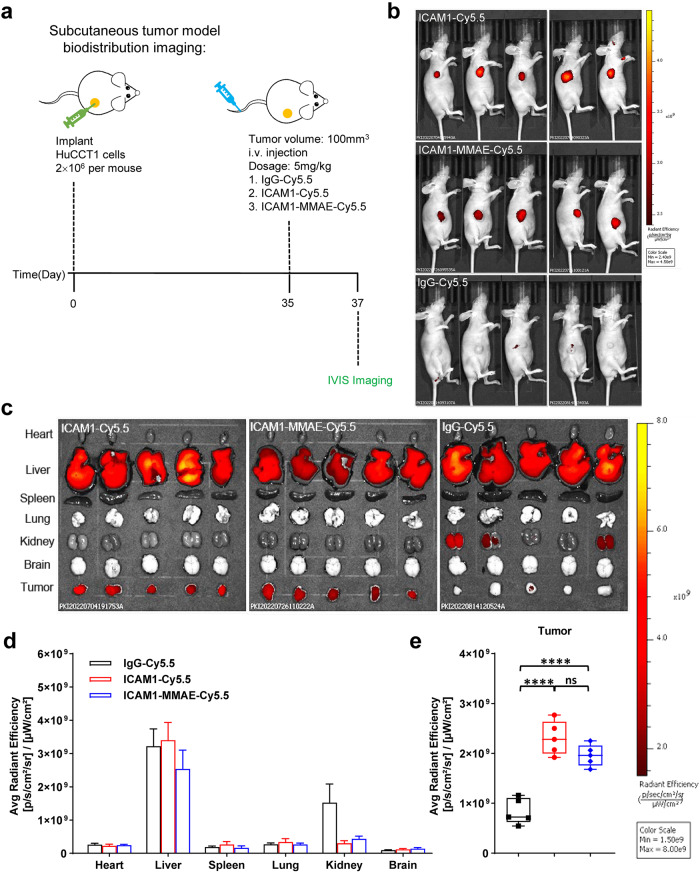
Fig. 4. Tumor-specificity and biodistribution of ICAM1 antibody and ICAM1-MMAE in vivo.
a Schematic design of CCA biodistribution study in a CCA tumor (HuCCT1) xenografted model. b In vivo NIR fluorescent images of nude mice at 48 h after the administration of IgG-Cy5.5, ICAM1-Cy5.5, and ICAM1-MMAE-Cy5.5 (N = 5 per group). c Representative ex vivo NIR fluorescent images of HuCCT1 tumor and six major organs (heart, liver, spleen, lung, kidney, and brain). d Quantified normal organ distribution of IgG-Cy5.5, ICAM1-Cy5.5, and ICAM1-MMAE-Cy5.5 (N = 5). e Quantified HuCCT1 tumor accumulation of IgG-Cy5.5, ICAM1-Cy5.5, and ICAM1-MMAE-Cy5.5 (N = 5 per group). Unpaired t-test, ****P < 0.0001, ns not significant. Error bars, SD. Median, quartiles, minimum, and maximum values are represented by the central line, limits of box, and ends of lines of boxplots shown.

