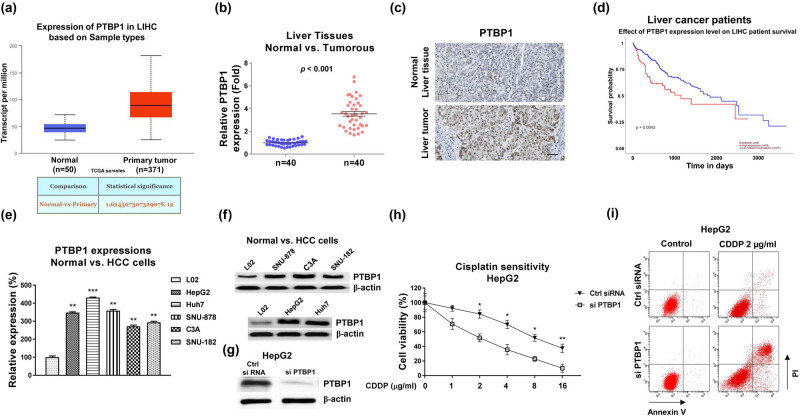
Figure 1.
PTBP1 is positively correlated with liver cancer and CDDP resistance. (a) Expressions of PTBP1 in liver cancer tissues and normal liver tissues analyzed from TCGA database. (b) Expressions of PTBP1 in liver cancer tissues (n = 40) and normal liver tissues (n = 40) examined by qRT-PCR. (c) Representative IHC staining of PTBP1 in normal and tumorous liver tissues. (d) Kaplan–Meier plotter survival analysis shows the correlation between PTBP1 expression levels and survival rates of liver cancer cells. (e) mRNA and (f) protein expressions of PTBP1 are shown in one normal hepatocyte cell line and five HCC cell lines. (g) HepG2 cells were transfected with control siRNA or PTBP1 siRNA, expressions of PTBP1 were detected by western blot. (h) The above transfected cells were treated with CDDP at the indicated concentrations for 48 h. Cell response to CDDP was determined by cell viability assay and (i) Annexin V apoptosis assay. *p < 0.05; **p < 0.01; ***p < 0.001.

