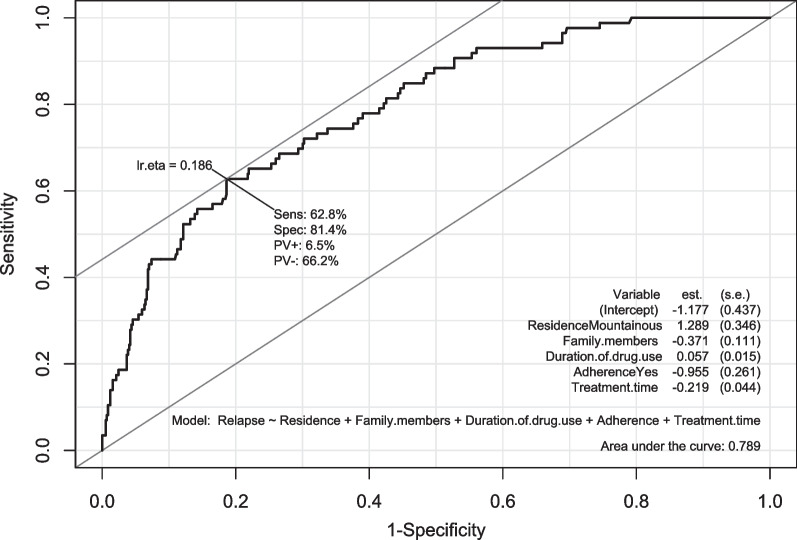
Fig. 1.
The receiver operating characteristic (ROC) curve analysis for the multivariate logistic regression model. Model: Opioid relapse ~ residence (metropolitan/mountainous) + the number of family members living with MMT patients + duration of drug use in the past (year) + treatment time (year) + treatment adherence (yes/no). The Hosmer–Lemeshow goodness of fit test results demonstrated that the multivariate logistic regression model could adequately fit the data (χ2 = 4.742, df = 8, p = 0.785). The AUC of this model was 0.789 (95% CI 0.741–0.839)

