Fig. 3:
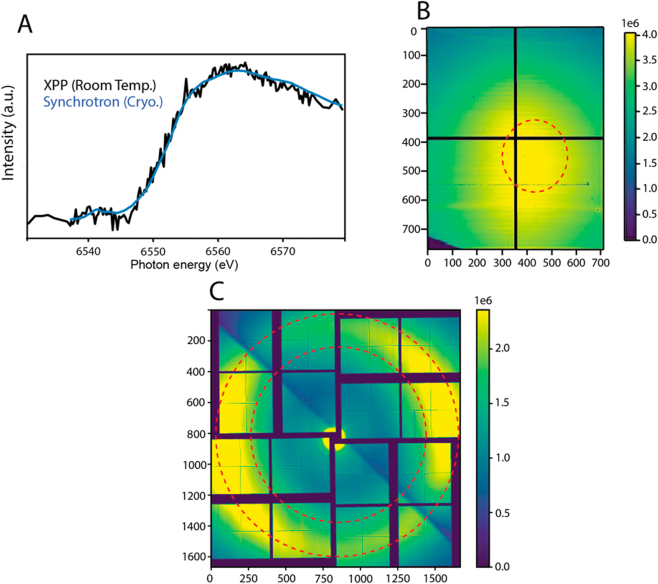
(A) Room temperature Mn K edge XAS spectrum from dark stable S1 state PS II (Black) collected at XPP (LCLS), in comparison to a corresponding synchrotron spectrum (blue) reported previously [30]. LCLS XAS data was collected from PS II solution sample (0.5 mM Mn) in 35 min with 120 Hz at XPP. Sample flow rate into the reservoir from which droplets are produced was 48 μL/min, and the total consumed sample volume was 1.6 mL. (B) Cumulative total fluorescence ePix-100 detector signal for XAS. A red dotted circle shows the region of interest (ROI). (C) Water scattering on the ePix-10k2m detector; the region used for normalization is located between the two red circles.

