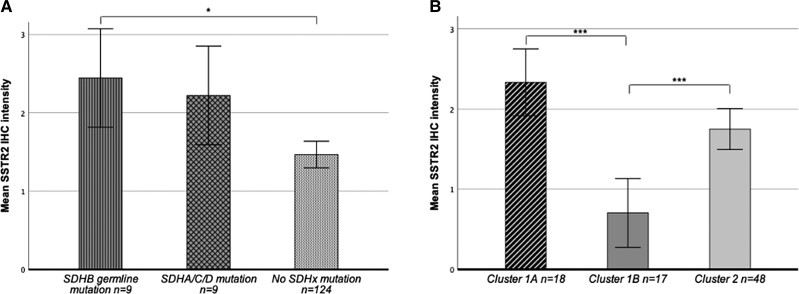
Figure 2.
(A) Mean SSTR2 staining intensity in SDHx-related PPGLs compared with PPGLs without SDHx mutations. SSTR2 IHC staining intensity was scored semiquantitatively according to the Volante score (0 = absence of staining, 3 = strong staining). Statistical significance is denoted with stars (*P < .05). Error bars show standard error of the mean (SEM). (B) Mean SSTR2 staining intensity according to cluster. SSTR2 IHC staining intensity was scored semiquantitatively according to the Volante score (0 = absence of staining, 3 = strong staining). According to their mutation profile, PPGLs are divided into 3 main molecular clusters: (1) pseudohypoxia cluster (1A and 1B), (2) kinase-signaling cluster 2, and (3) Wnt signaling cluster 3. Cluster 1 is further divided into cluster 1A (mutations in the Krebs cycle associated genes) and 1B (mutations in the hypoxia-signaling pathway). Statistical significance is denoted with stars (***P < .001). Error bars show standard error of the mean (SEM).

