
Fig. 4.
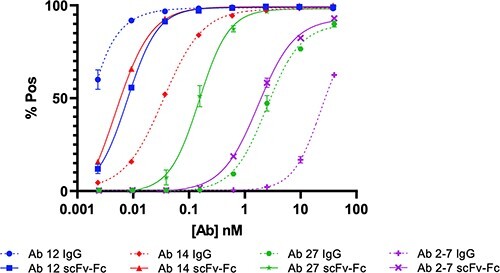
FACS binding curves comparing selected IgG and scFv-Fc pairs. (A) FACS binding curves with 293T-Spike cells show a pronounced decrease in binding for Abs 14, 27 and 2-7, whereas Ab 12 shows an increase in binding.
Official websites use .gov
A
.gov website belongs to an official
government organization in the United States.
Secure .gov websites use HTTPS
A lock (
) or https:// means you've safely
connected to the .gov website. Share sensitive
information only on official, secure websites.
FACS binding curves comparing selected IgG and scFv-Fc pairs. (A) FACS binding curves with 293T-Spike cells show a pronounced decrease in binding for Abs 14, 27 and 2-7, whereas Ab 12 shows an increase in binding.