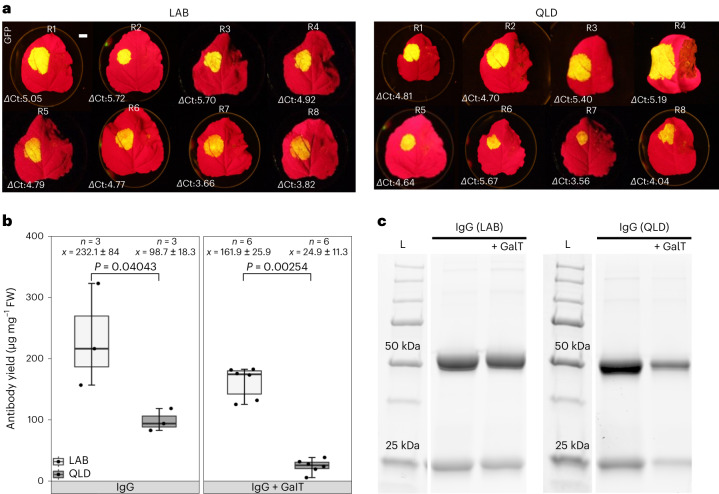
Fig. 4. Comparison of transient expression in LAB and QLD of GFP by syringe agro-infiltration and antibody production by vacuum agro-infiltration.
a, Transient expression of GFP in LAB and QLD. Quantitative polymerase chain reaction cycle threshold (Ct) values were measured and ΔCt calculated as the difference in Ct between the gene of interest (GFP) and the reference gene (GAPDH) for each sample. GFP expression levels are represented underneath each leaf as ΔCt. All reactions were performed in triplicate for each complementary DNA sample. All experiments were performed in eight independent biological replicates. The average ΔCt of LAB and QLD was 4.8 and 4.7, respectively. Statistical analysis of the two-tailed Student’s t-test (P = 0.7972) and z-test (P = 0.9949) shows that there was no significant difference between GFP expression levels in the two ecotypes. Scale bar, 1 cm. b, Antibody concentration in total soluble protein extracts from LAB (white) and QLD (grey) ecotypes measured by protein A biolayer interferometry in μg mg−1 of tissue fresh weight (FW). P values were determined by Mann–Whitney U-test comparing between ecotypes. For ‘n’, samples are biologically independent transient infiltrations, sampled at 7 days post infiltration. Box and whisker plot interpretation: each box spans the interquartile range with the ends of the box being the upper and lower quartiles. The median is represented by a vertical line inside the box. Whiskers outside the box extend to the highest and lowest observations. GalT, galactosyl transferase; IgG, immunoglobulin G. c, SDS–polyacrylamide gel electrophoresis showing protein A-purified trastuzumab under reducing condition, similar results were observed in three independent replicates (n = 3).

