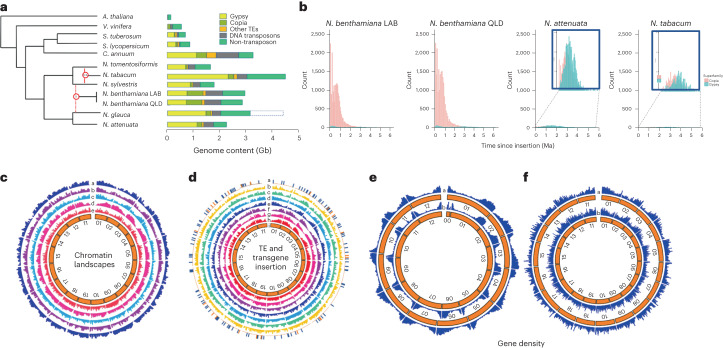
Fig. 5. Transposon, epigenetic landscapes and gene density of N. benthamiana.
a, Relative complements of transposon and non-transposon content in Arabidopsis thaliana, Vitis vinifera and key Solanaceous and Nicotianas are presented as their calculated genome content in Gb. The dashed box for N. glauca indicates the genome size calculated from k-mer analysis (4.5 Gb), whereas the composition of the genome is based on the current assembly of 3.2–3.5 Gb. Many Gypsy-like sequences are present in the ‘other TE’ category in N. benthamiana. b, Estimated dates of LTR-retrotransposon insertion, calculated by sequence comparison between the LTRs of individual element insertions, in N. benthamiana LAB and QLD, compared with N. attenuata and N. tabacum. A clear and ongoing large burst of Copia element activity is evident in both LAB and QLD, which is absent in both N. attenuata and N. tabacum. The reported burst of Gypsy activity in Nicotianas appears to predate the 6 Ma limit of our analysis. c, A Circos plot depicting the chromatin landscape compared with gene content in LAB. Tracks a and b represent respectively the location of permissive histone marks H3K27ac and H3K4me3 within each LAB chr. Track c depicts the gene density across the LAB genome, whereas tracks d and e represent the location or repressive histone marks H3K9me2 and H3K27me3, respectively. d, Circos plot depicting the comparative locations of transgene insertions, LTR-retrotransposon insertion and methylation marks across LAB chromosomes. Track a, transgene insertion sites; red ‘ticks’ represent insertions derived from stable transformation, blue ‘ticks’ represent insertions derived from transient agro-infiltration. Track b, insertions of intact Copia TEs (containing matching LTRs and complete internal sequences). Track c, insertion of all annotated Copia TEs, including fragmented elements. Track d, distribution of CHH methylation marks. Track e, gene density across the LAB genome. Track f, insertions of all annotated Gypsy TEs, including fragmented elements. Track g, distribution of CG methylation marks. Track h, distribution of CHG methylation marks. The innermost circle represents the numbered chromosomes. e, Distribution of gene densities on the chromosomes of potato (inner circle) and tomato (outer circle). f, Distribution of gene densities on the chromosomes of LAB (inner circle) and QLD (outer circle) genomes.

