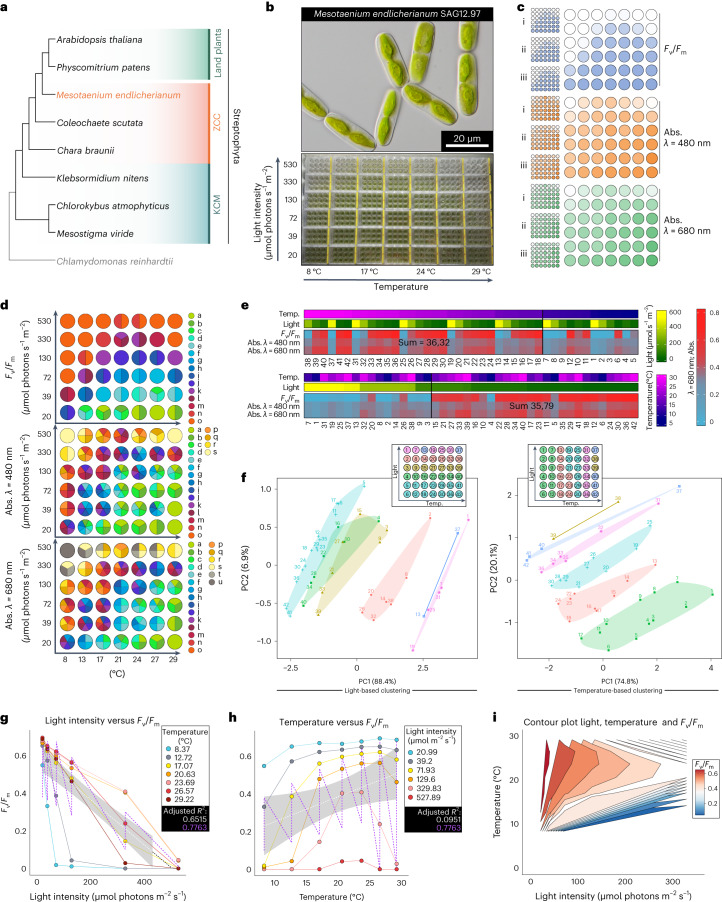
Fig. 1. A fine-combed setup for assessing environmental responses in Mesotaenium.
a, Cladogram of Streptophyta, highlighting that Mesotaenium endlicherianum SAG 12.97 is a representative of the closest algal relatives of land plants. KCM, the grade of Klebsormidiophyceae, Chlorokybophyceae and Mesostigmatophyceae; ZCC, the grade of Zygnematophyceae, Coleochaetophyceae and Charophyceae. b, M. endlicherianum grown in C-medium in 42 12-well plates on a gradient table that produces a temperature range of 8.6 ± 0.5 °C to 29.2 ± 0.5 °C on the x axis and an irradiance gradient of 21.0 ± 2.0 to 527.9 ± 14.0 µmol photons m−2 s−1 on the y axis; for phenotyping per well, at least ten micrographs were taken, all showing similar phenotypes of the cells. c, Overview of the measured maximum quantum yield Fv/Fm as a proxy for gross physiology (blue) and absorption (abs.) at 480 (orange) and 680 nm (green); individual replicates of the biological triplicates are shown on the left and the average values are shown on the right. d, Statistical analysis of the physiological values (Fv/Fm, abs. 480 nm, abs. 680 nm). Numbers correspond to environmental conditions on the table. Biological triplicates were grouped into significant groups (a–o, a–s and a–u) with R (version 4.1.3) using a Kruskal–Wallis test coupled with Fisher’s least significance; P values were Bonferroni corrected. Significant differences at P ≤ 0.001 are shown as letters. e, Heat maps displaying averaged physiological values of the 42 conditions sorted either by temperature (temp.) or light. A cut-off was set (black vertical line) on the basis of the distribution of the highest values, which were then summed to determine a positive correlation with temperature or light conditions. f, Two PCAs showing the correlation of light conditions (left) or temperature conditions (right) to physiological values (Fv/Fm, abs. 480, 680 nm). Clusters are shown in different colours, which are also visualized in an overview scheme of the gradient table at the top of the plots. g,h, Unifactorial regression analysis of light intensity (g) and temperature (h) versus Fv/Fm; note the unifactorial linear regression curves (white) versus the bifactorial (violet). i, Contour plot of the bifactorial impact of light and temperature on Fv/Fm (gradient colour).

