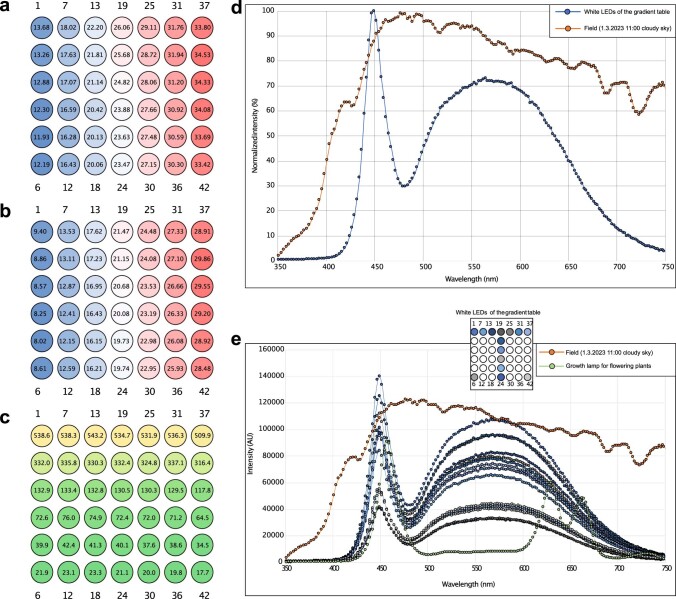
Extended Data Fig. 4. Pre-experimental setups: temperature conditions comparison, light intensities, and light spectra.
(a) Temperature conditions for the first experimental setup (n1(I)) depicted by a blue to red color gradient (see also supplementary table ST 1.4). (b) Temperature conditions for the second and the final experimental setup (n1(II), n2(II), n1(III), n2(III), and n3(III)) depicted by a blue to red color gradient (see also supplementary table ST 1.2). (c) Light intensity/irradiance values depicted by a green to yellow color gradient (see also supplementary table ST 1.1). (d) Average light spectra of the gradient table (blue) assessed using SpectraPen (PSI, Brno, CZ) compared to a spectra assessed of natural sunlight (orange). (e) Light spectra of various plates of the gradient table (see overview) in various shades of blue assessed using SpectraPen (PSI, Brno, CZ) compared to a light spectrum assessed of natural sunlight (orange) and a light spectrum from a growth lamp used for flowering plants.

