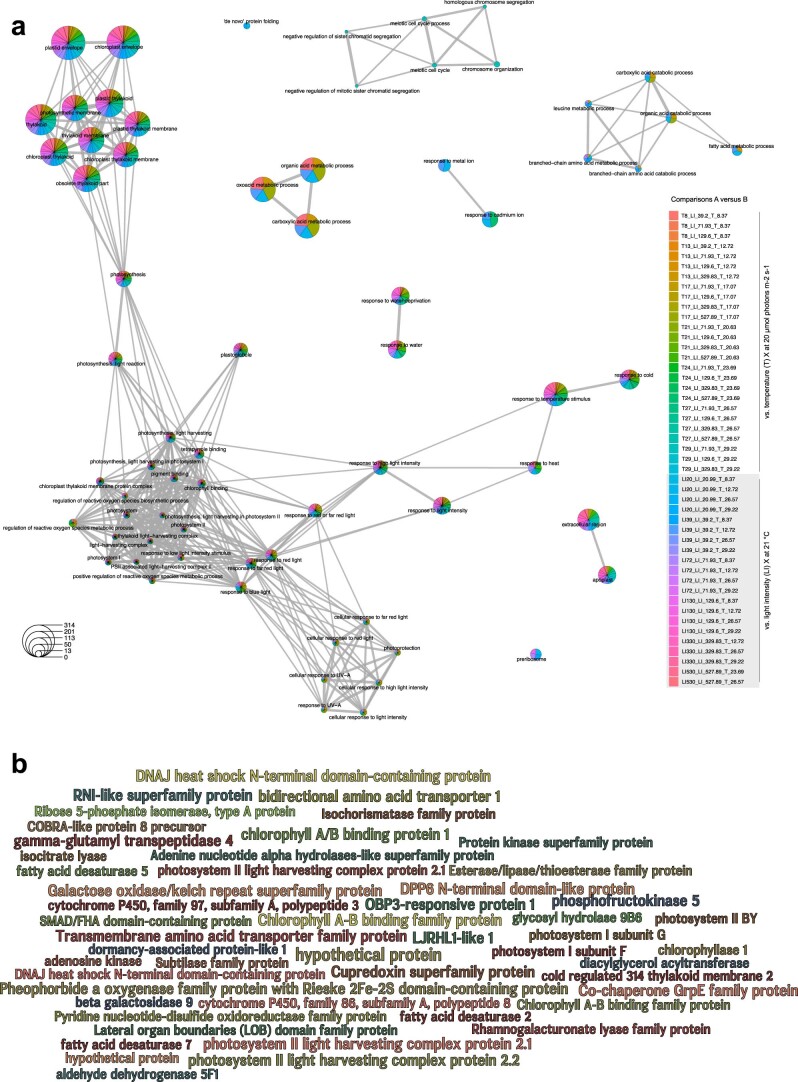
Extended Data Fig. 7. Differential gene expression comparisons highlight plastid-related responses.
(a) Biological theme comparison of GO terms enriched in differential gene expression analyses in which one factor was always kept constant; the top 10 different connected graphs are shown. (b) Wordle of the 124 genes that showed significant regulation across multiple comparisons shown in main Fig. 2f,g and Extended Data Fig. 1; word size correspond to the number of comparisons in which a gene appeared. Color serves to increase the contrast between words.

