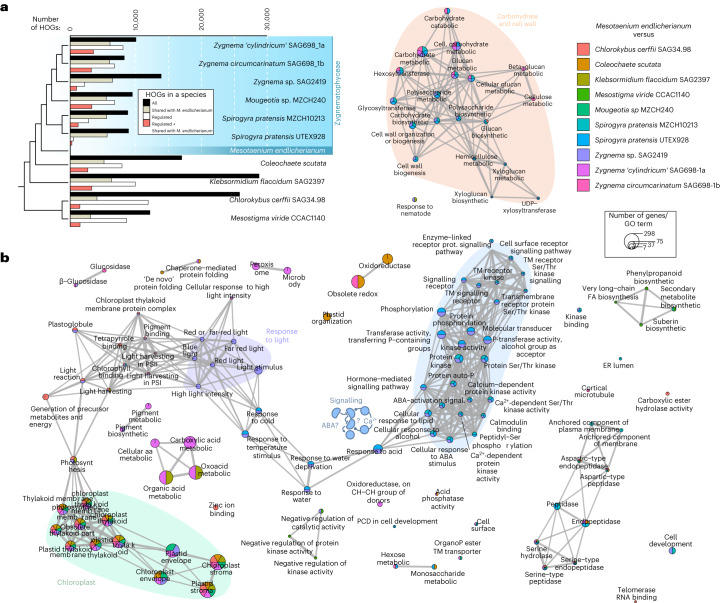
Fig. 3. Comparative analyses of global differential gene expression profiles across stress-treated streptophyte algae.
Publicly available data on stress transcriptomes from ten different streptophyte algae were downloaded and significant differential gene expression between stress treatment and control per species were calculated. Phylogenetic HOGs were inferred with Orthofinder. a, Bar graph of the number of all HOGs detected (black), HOGs shared with Mesotaenium endlicherianum (tan), all regulated HOGs in a given species (white) and, of those regulated, which are in the same HOG as significantly regulated genes in Mesotaenium (red); the relationship between the streptophyte algae is shown by the cladogram on the left. b, GO term-based biological theme comparison of these shared significantly regulated genes in HOGs. Note the recurrent pattern of chloroplast-associated differential gene expression (green), light quality (purple) and the putative integration of calcium signalling with pathways known from phytohormone signalling, including ABA, in land plants (blue, also note the little sketch of a hypothetical model). PCD, programmed cell death.

