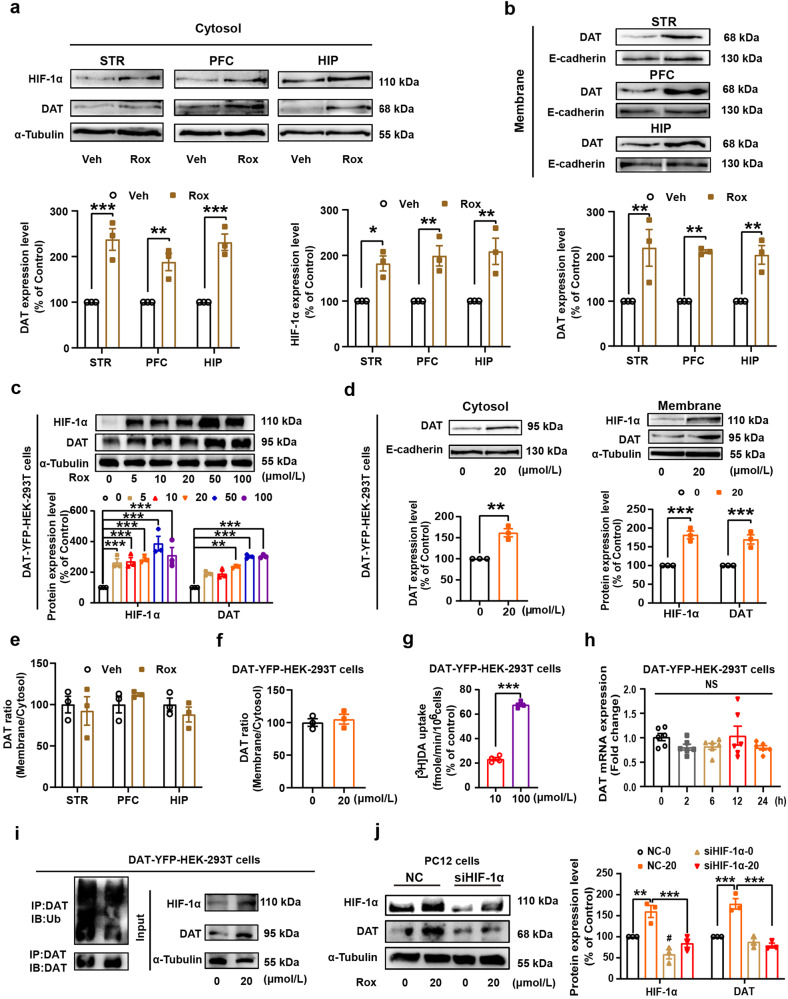
Fig. 5.
Rox treatment increases plasma DAT expression and uptake activity. a, b WT mice were sacrificed after 6 h roxadustat (10 mg/kg) administration. Then, mice brain tissues (STR, PFC and HIP) were collected and the plasma membrane and cytosol protein were extracted as described in Methods for immunoblot assays. Rox treatment increased DAT expression in plasma and cytosol (a: DAT, n = 3, drug, F(1,12) = 101.7, P < 0.0001; area, F(2,12) = 1.732, P = 0.2184; drug × area, F(2,12) = 1.732, P = 0.2184; HIF-1α, n = 3, drug, F(1,12) = 53.13, P < 0.0001; area, F(2,12) = 0.3386, P = 0.7149; drug × area, F(2,12) = 0.3386, P = 0.7149. b: n = 3, drug, F(1,12) = 52.32, P < 0.0001; area, F(2,12) = 0.08727, P = 0.9170; drug × area, F(2,12) = 0.08727, P = 0.9170). c YFP-tagged DAT stablely expressed HEK-293T (DAT-YFP-HEK-293T) cells were treated with Rox at indicated concentration (0–100 μmol/L) for 24 h and prepared for immunoblot assays. Rox treatment increased HIF-1α and DAT expression in DAT-YFP-HEK-293T cells (n = 3, drug, F(5,24) = 25.23, P < 0.0001; protein, F(1,24) = 12.81, P = 0.0015; drug × protein, F(5,24) = 1.249, P = 0.3177). d DAT-YFP-HEK-293T cells were treated with 20 μmol/L roxadustat for 24 h. Then, the plasma membrane and cytosol protein were extracted as described in Methods and prepared for immunoblot assays. Rox treatment increased expression of DAT in both plasma and cytosol and HIF-1α in cytosol in DAT-YFP-HEK-293T cells (membrane, n = 3, t = 6.521, df = 4, P = 0.0029. cytosol, n = 3, drug, F(1,8) = 90.17, P < 0.0001; protein, F(1,8) = 0.5780, P = 0.4689; drug × protein, F(1,8) = 0.5780, P = 0.4689). e-f Rox treatment did not change the ratio of plasma membrane and cytosol DAT in mice brain tissues as well as in DAT-YFP-HEK-293T cells (e n = 3, drug, F(1,12) = 0.092, P = 0.7667; area, F(2,12) = 0.7726, P = 0.4835; drug × area, F(1,12) = 0.7726, P = 0.4835. f n = 3, t = 0.5311, df = 4, P = 0.6235). g [3H] DA uptake assays in DAT-YFP-HEK-293T cells treated with 10 μmol/L or 100 μmol/L of Rox for 24 h. Rox treatment increased DAT uptake activity as indicated by increased [3H] DA uptake (n = 4, t = 24.21, df = 6, P < 0.0001). h 20 μmol/L Rox treatment for 0–24 h did not alter DAT mRNA expression in DAT-YFP-HEK-293T cells (n = 6, F(4,25) = 1.391, P = 0.2658). i Rox treatment (20 μmol/L, 24 h for cells and 10 mg/kg, 6 h for mouse) inhibited DAT ubiquitination. DAT-YFP-HEK-293T cell lysates were precipitated with DAT antibody-conjugating agarose beads to purify DAT proteins. Followed by immunoblotting with anti-ubiquitin and anti-DAT antibody to detect the ubiquitination levels of DAT and DAT expression in the purified samples, respectively. Total cell lysate was used to detect the total expression of HIF-1α, DAT and α-Tubulin by immunoblotting with specific anti-HIF-1α, anti-DAT and anti-α-Tubulin antibodies. j HIF-1α siRNA (50 pmol/L) was transfected into PC12 cells for 48 h to knockdown HIF-1α as described in Methods. Then, PC12 cells were treated with roxadustat (20 μmol/L) for another 24 h before collection for immunoblot assays. Knockdown of HIF-1α by siRNA transfection abolished Rox efficacy in upregulation of HIF-1α and DAT (n = 3, group, F(3,16) = 45.42, P < 0.0001; protein, F(1,16) = 2.698, P = 0.1200; group × protein, F(3,24) = 1.566, P = 0.2366). Representative images for a-d are shown in the upper panels and quantitative data are shown in the lower panels. Representative images for j are shown in the left panels and quantitative data are shown in the right panels. Values are presented as means ± SEM. Statistical analyses for a-c, d (cytosol), e and j, and for d (membrane) and f-g, and for h were performed using two-way ANOVA followed by Bonferroni-corrected tests and Student’s t-test and one-way ANOVA followed by Bonferroni-corrected tests, respectively. *P < 0.05, **P < 0.01, ***P < 0.00; NS: not significant

