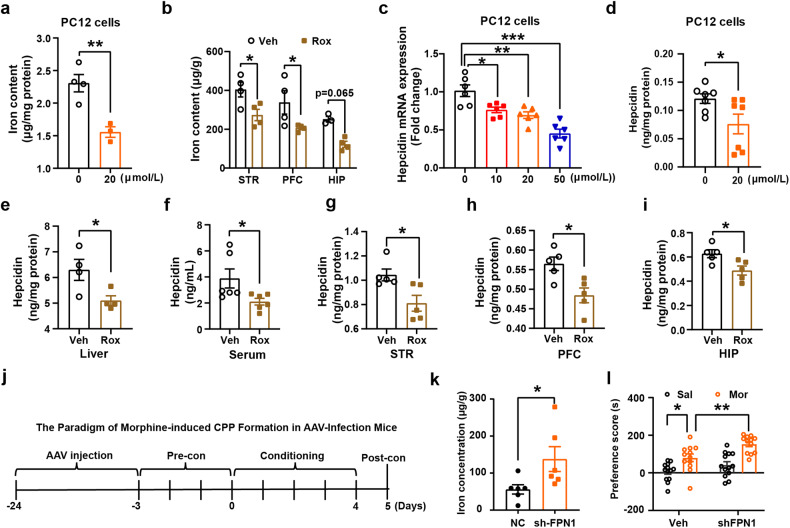
Fig. 6.
Rox treatment inhibits iron accumulation by reducing hepcidin expression and knockdown of FPN1 induces susceptibility of Mor-CPP. a PC12 cells were treated with 20 μmol/L roxadustat for 24 h. Then, the cells were prepared for ICP-MS detection of total iron content. Rox treatment lowered iron content in PC12 cells (0 μmol/L, n = 4, 20 μmol/L, n = 3, t = 4.382, df = 5, P = 0.0071). b WT mice were sacrificed after 6 h roxadustat (10 mg/kg) injection, the brain tissues, liver and serum were collected for ICP-MS detection of total iron content. Rox injection lowered iron content in STR (n = 4), PFC (n = 4) and HIP (Veh, n = 3, Rox, n = 4, drug, F(1,17) = 21.65, P = 0.0002; area, F(2,17) = 9.455, P = 0.0017; drug × area, F(2,17) = 0.0007598, P = 0.9992). c, d PC12 cells were treated with 20 μmol/L Rox for 24 h. Then, the cells were prepared for q-PCR and Elisa assays, Rox treatment lowered the expression of hepcidin in PC12 cells (c, n = 6, F(3,20) = 17.53, P < 0.0001. d, n = 7, t = 2.310, df = 12, P = 0.0395). e-i ELISA of hepcidin protein in Rox (10 mg/kg, 6 h) treated WT mice. Rox treatment lowered the expression of hepcidin in mouse liver (n = 4, t = 2.648, df = 6, P = 0.0381), serum (n = 6, t = 2.312, df = 10, P = 0.0433), STR (n = 5, t = 2.868, df = 8, P = 0.0209), PFC (n = 5, t = 3.169, df = 8, P = 0.0132), and HIP (n = 5, t = 2.807, df = 8, P = 0.0229). j The paradigm of Mor-CPP in AAV-infection mice. pAKD-CMV-bGlobin-mCherry-3*FLAG-WPRE-H1-shRNA and pAAV-CBG-mCherry-3*FLAG-WPRE-H1-shFPN1 virus were injected into NAc for 21 days before CPP performance. k, l After 21 days virus infection, mice brain tissues were collected and prepared for iron content detection with ICP-MS, FPN1 knockdown induced iron accumulation in NAc (n = 6, t = 2.294, df = 10, P = 0.0447). FPN1 knockdown mice were more sensitive to Mor-CPP as evidenced by higher CPP scores in shFPN1+Mor group as compared with Veh+Mor group. (NC-Sal, n = 13; NC-Mor, n = 12; sh-FPN1+Sal, n = 13; sh-FPN1+Mor, n = 12; group; F(1,46) = 10.96, P = 0.0018, drug, F(1,46) = 32.08, P < 0.0001; group × drug, F(1,46) = 1.313, P = 0.2578). Values are presented as means ± SEM. Statistical analyses for a and d–i and k, and for b and l, and for c were performed using Student’s t-test and two-way ANOVA and one-way ANOVA followed by Bonferroni-corrected tests, respectively. *P < 0.05, **P < 0.01, ***P < 0.001

