Figure 1.
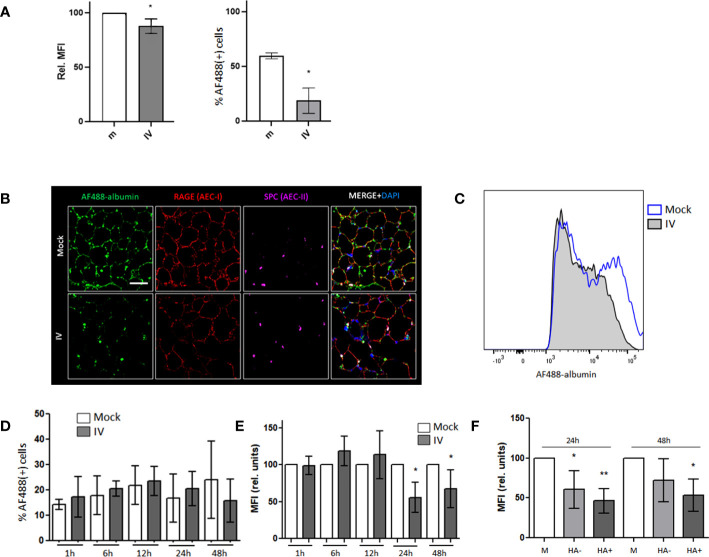
Albumin endocytosis is impaired in IV-infected AECs. (A) MLE-12 cells were inoculated with IV for 24 h and incubated with AF488-albumin for 1 h before being analyzed by FC. Image shows the relative median fluorescence intensity (MFI) of AF488 (left) and the percentages of cells that stained positive for AF488 (right). (B) Confocal images of PCLS mock and IV inoculated with 1x10⁶ pfu of IV for 24 h, incubated in AF488-albumin (green) 250 µg/mL for 60 min and then fixed and stained with RAGE (red) and SPC (purple) antibodies. Scale bar 50 µm. Zoom 63X. (C–F) PCLS were inoculated with IV for 1 h, 6 h, 12 h, 24 h and 48 h and incubated in AF488-albumin for 60 min. Images show FC analysis of albumin uptake in EpCAM+ cells. (C) Representative histograms for AF488-albumin fluorescence in AEC from mock and IV inoculated PCLS at 24h post inoculation. (D) Percentage of AF488-albumin+ cells. (E) AF488 MFI in the general AEC population from mock and IV-inoculated PCLS. (F) Graph showing the MFI analysis from AEC from mock PCLS (M), AEC from inoculated PCLS that did not express (HA-) or that expressed viral proteins (HA+). All bar graphs show mean ± SD of 3 to 6 independent experiments. Statistic comparisons are relative to mock controls. *p<0.05; **p<0.01.

