Figure 2.
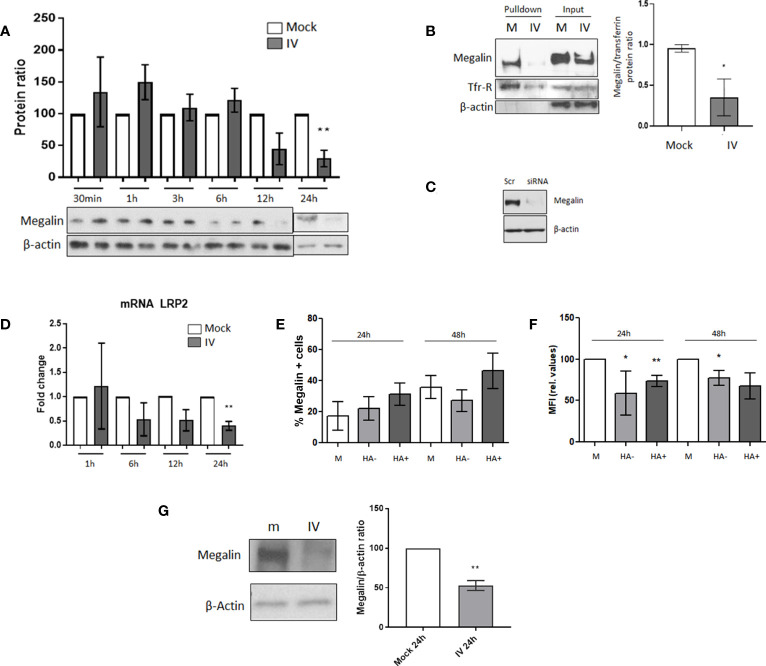
Megalin cell surface expression is downregulated in AECs under IV infection conditions. (A) MLE-12 cells were inoculated with IV at MOI 1, incubated for 30 min, 1 h, 3 h, 6 h, 12 h and 24 h The graph shows the western blot densitometry analysis normalized to beta-actin and to each mock control. A representative blot for each time point is shown. (B) Cell-surface biotinylation assay was performed in MLE-12 cells inoculated with IV MOI 1 incubated for 24 h Left: representative blot. Right: Densitometry analysis and quantification of megalin, normalized to transferrin. (C) Antibody specificity characterization: megalin siRNA was transfected into to MLE-12 cells and megalin expression was analyzed by western blot. Scr: scrambled RNA (control). (D) mRNA was isolated from mock and IV-treated cells, at 1, 6, 12 and 24 h post infection. LRP2 transcription levels were quantified by qPCR. (E, F). PCLS were treated in mock or IV conditions. After dissociation, live AEC were analyzed by FC. (E) Percentages of cells expressing megalin on their surface at 24 h and 48 h post inoculation. EpCAM+ cells from mock PCLS (M) or from IV-inoculated PCLS expressing (HA+) or not expressing (HA-) viral proteins are shown. (F): Relative MFI for megalin expression on the cell surface, calculated as MFI APC of cells stained with an APC-megalin antibody- MFI of FMO control. (G) PCLS mock (m) and IV-inoculated (IV) were incubated for 24 h and extracted proteins were analyzed by western blot. Left: Representative immunoblot for total cell megalin expression. Right: Densitometric quantification of megalin (600 kDa) expression, relative to actin and mock. All bar graphs show mean ± SD of 3 to 6 independent experiments. Statistic comparisons are relative to mock controls. *p<0.05; **p<0.01.

