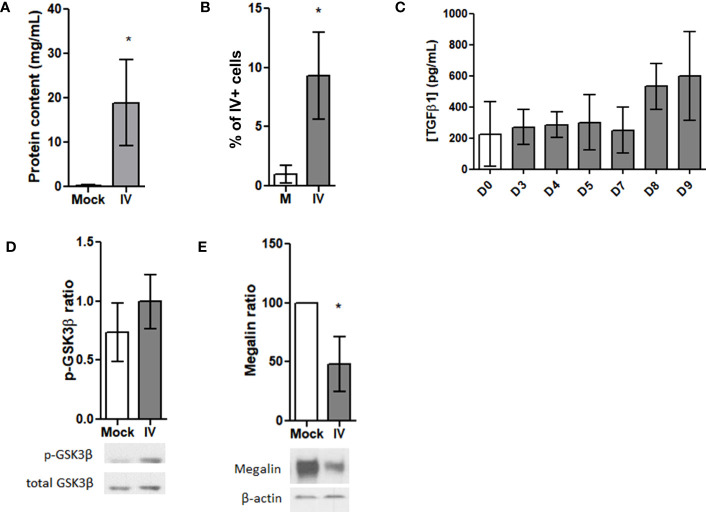
Figure 4.
Megalin is downregulated in AEC from IV-infected mice. (A–F) Lung samples were obtained from mice 5 days after intratrachaeal instillation of 350 pfu of IV (n=5). (A) Whole protein contents from the BAL fluid of control (Mock) and infected (IV) mice. (B) AEC from lung samples were analyzed by FC for viral proteins (HA). Graph shows percentages for HA+ cells in mock (M) and infected (IV) samples. (C) TGF-β1 levels were measured in the BALF from control and IV-infected mice following 3, 4, 5, 7, 8 and 9 days of infection by ELISA. (D, E) AEC were isolated and analyzed by western blot. (D) Top: Densitometric quantification of p-GSK3β. Bottom: Representative blot. (E) Top: Densitometric quantification of megalin. Bottom: Representative blot. *p<0.05.

