Figure 5.
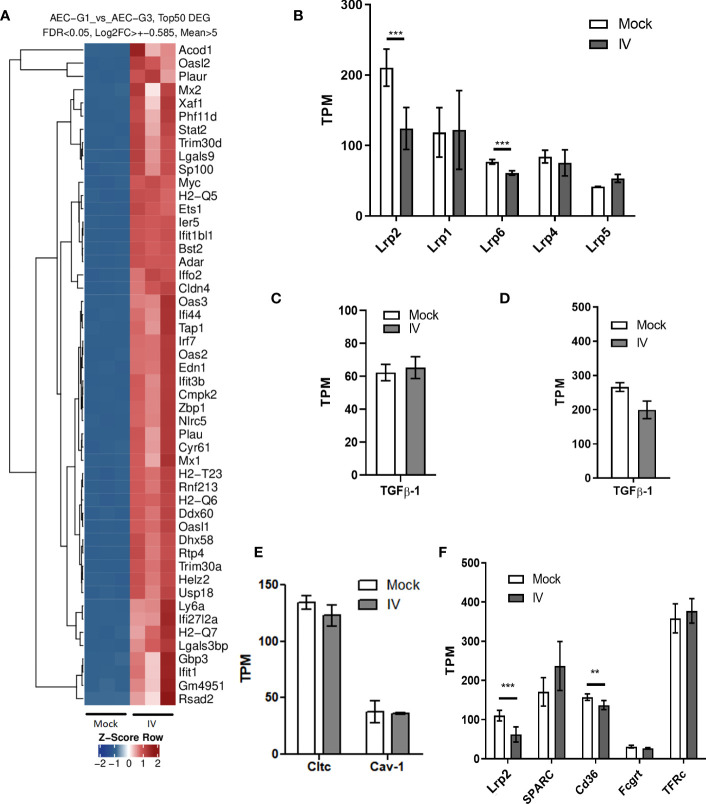
mRNA expression in AEC and BAL fluid cells from IV-infected mice. (A) Top 50 differentially expressed genes (DEG) in AEC. (B) mRNA levels of the top 6 most expressed LDL receptor family members in AEC. (C, D) Tgfb1 mRNA levels in AEC (C) and BAL fluid cells (D). (E) mRNA levels of clathrin (Cltc) and caveolin-1 (Cav-1) in AEC. (F) mRNA expression levels of the albumin receptors megalin, secreted protein acidic and rich in cysteine (Sparc), the scavenger receptor Cd36, and neonatal Fc receptor (Fcgrt) in mock and infected (IV) AEC. Expression levels or transferrin receptor (TFr) are shown for comparison. Normalized RNAseq data, n=3. Bars represent mean ± SD. TPM: transcripts per million. **p<0.01; ***p<0.005.

