Figure 6.
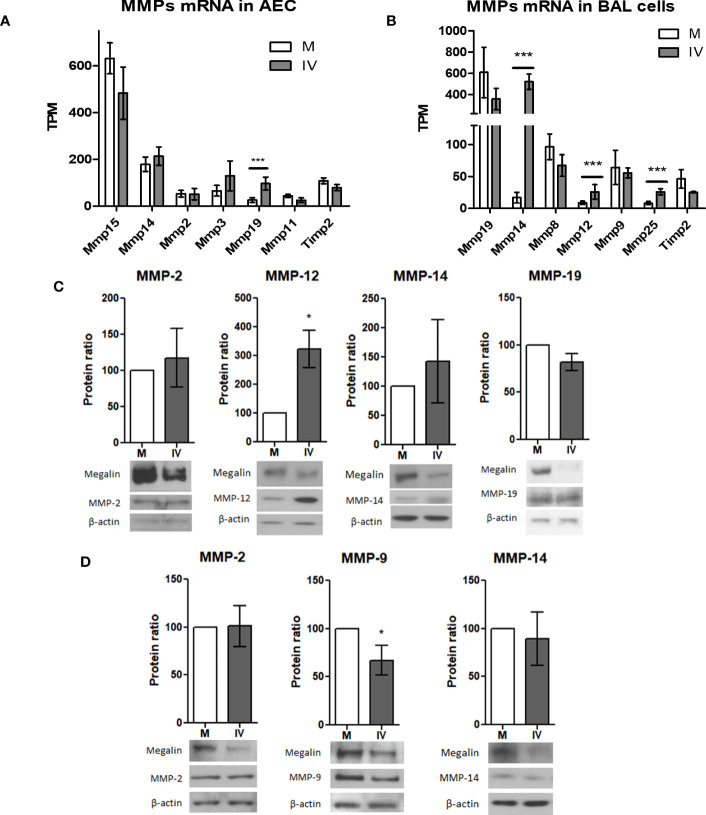
IV infection alters MMP expression levels in AEC and BAL fluid cells.(A, B) mRNA levels of the top 6 most expressed MMP and Timp2 in AEC (A) and BAL (B) from infected mice. Normalized RNAseq data, n=3. Bars represent mean ± SD. TPM: transcripts per million. (C, D) MLE-12 cells (C) or PCLS (D) were inoculated with IV for 24 h and the protein extracts analyzed by western blot. Representative blots and MMP/actin densitometry ratio graphs are shown. Values represent mean ± SD, n=3. (C) In MLE-12 cells protein expression of MMP-12 was upregulated in IV conditions, while expression of MMP-2, MMP-14 and MMP-19 did not show significant differences. Representative megalin and actin immunoblots are shown. (D) In PCLS, protein expression of MMP-9 was downregulated, while no significant differences were found in MMP-2 and MMP-14 expression. *p<0.05; ***p<0.005.

