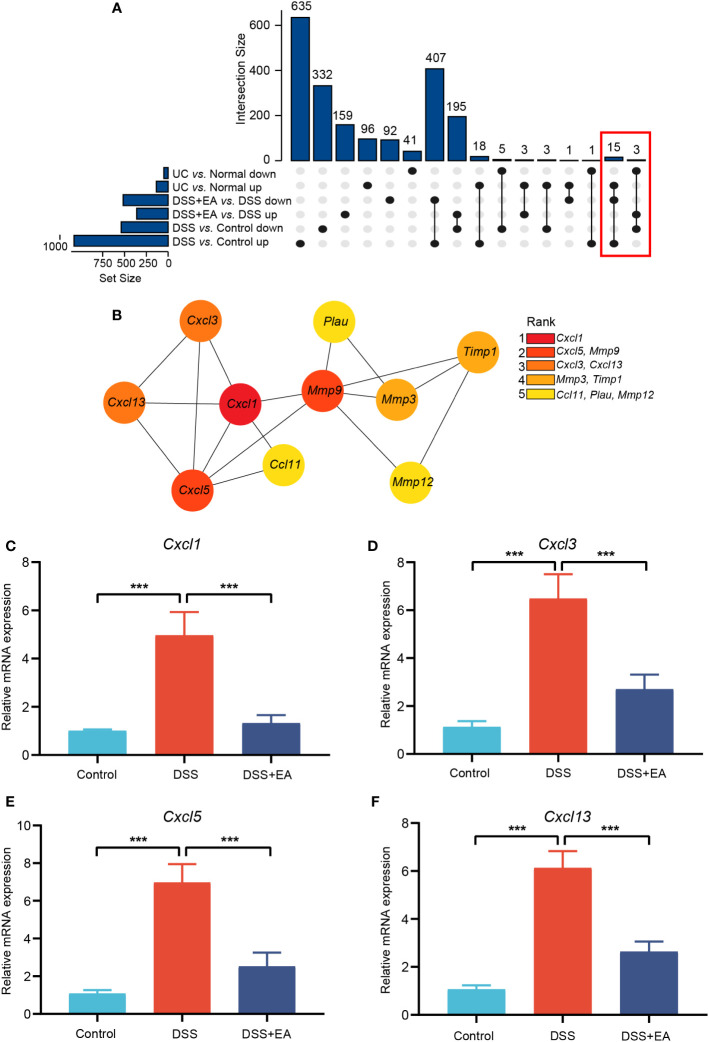
Figure 5.
Integrating mice and human DEGs. (A) UpSet plot of co-DEGs. (B) Subnetwork of co-DEGs identified in STRING. Co-DEGs identified by cytoHubba. Red-yellow color gradient reflects (from high to low) each node’s connection degree. (C) Relative expression of Cxcl1 mRNA (n = 6). (D) Relative expression of Cxcl3 mRNA (n = 6). (E) Relative expression of Cxcl5 mRNA (n = 6). (F) Relative expression of Cxcl13 mRNA (n = 6). Data are show as mean ± SEM. ***P < 0.001.

