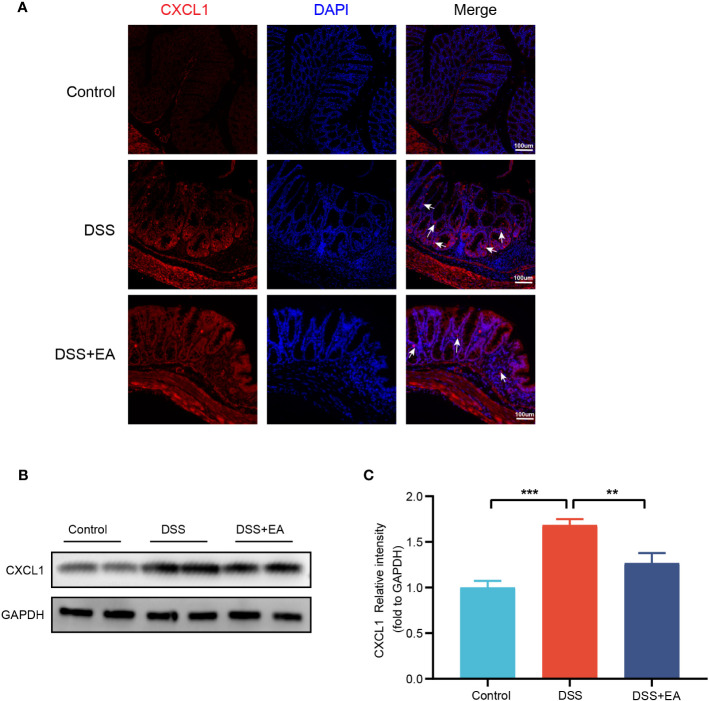
Figure 7.
Colonic CXCL1 expression in the different groups. (A) CXCL1 immunohistochemical staining (red expresses CXCL1-positive cells and blue expresses DAPI). (B) Western blot of CXCL1 expressions in colon tissues. (C) The relative intensities of CXCL1 as normalized against GAPDH (n = 4). Data are show as mean ± SEM. **P < 0.01, ***P < 0.001. To fit into the manuscript properly, the gel was reasonably trimmed.

