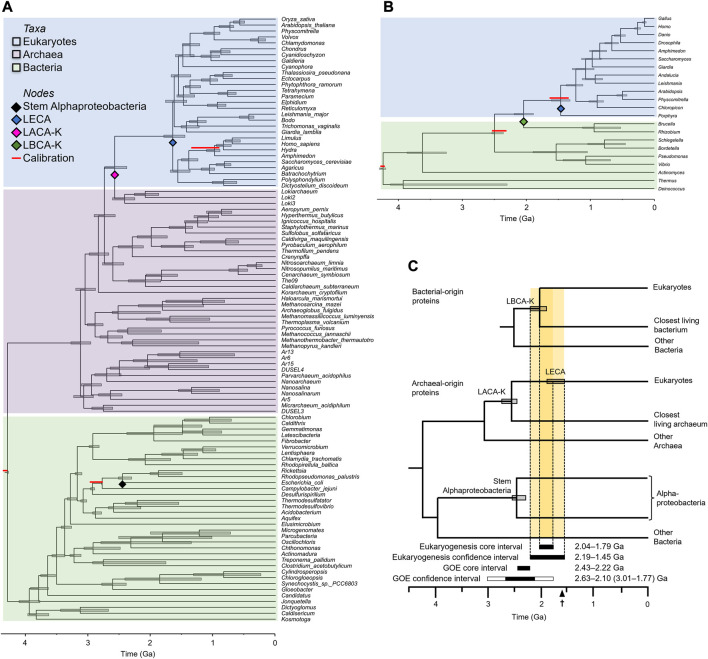
FIGURE 2.
Inferring the eukaryogenesis interval. (A) Phylogeny derived from eukaryotic proteins of archaeal origin. (B) Phylogeny derived from eukaryotic proteins of bacterial origin. Red bars above nodes indicate literature consensus calibrations. Note that the divergence most proximate to eukaryogenesis, between either LACA-K or LBCA-K and eukaryotes, is never calibrated. For the phylogeny of bacterial proteins, the minimal calibration scheme is not shown, but resulted in nearly identical estimates of the eukaryogenesis interval (see Methods). (C) Summary timetree showing the inferred time intervals for eukaryogenesis and the Great Oxidation Event (GOE). The core eukaryogenesis interval is bounded by the major constraining mean times for LBCA-K and LECA whereas the conservative eukaryogenesis interval also considers the 95% confidence intervals on those dates. The core GOE interval is bounded by the consensus of environmental proxy dates (Poulton et al., 2021) whereas the conservative GOE interval also considers the 95% confidence intervals (CIs) on those dates (Hodgskiss and Sperling, 2022), with bounds determined by (left to right) Nonzero I/(Ca + Mg) (3.01 Ga), red beds (2.63 Ga), MIF-S (2.10 Ga), and RSDM (1.77 Ga); all using the optimal linear estimation method. The earliest eukaryotic fossil (1.62 Ga) is indicated on the scale bar.

