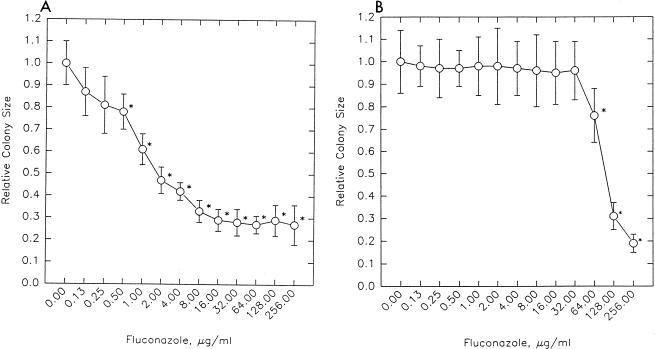
FIG. 1.
Relative colony sizes of two C. albicans strains at 13 drug concentrations. Drug concentrations are shown on the x axis, and relative average colony sizes and standard deviations are on the y axis. (A) C. albicans MMRL390 (fluconazole MIC, 0.5 μg/ml). (B) C. albicans MMRL419 (fluconazole MIC, 64 μg/ml). An asterisk denotes statistical significance (P < 0.01).

