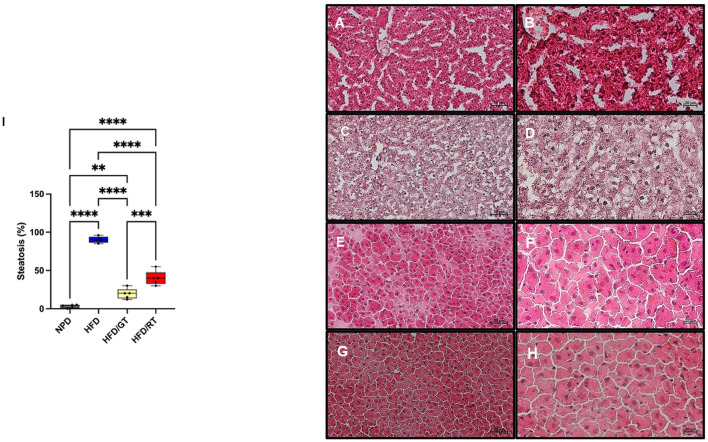
Figure 5.
Representative images of the histological evaluation of the liver parenchyma on hematoxylin and eosin staining. [(A, B) Control NPD; (C, D) HFD; (E, F) HFD/RT; (G, H) HFD/GT]. (A, C, E, G) Magnification 200×, scale bar 50 μm. (B, D, F, H) Magnification 400×, scale bar 20 μm. (I) Percentage of steatosis. Data are presented as the mean ± SD. NPD vs HFD: p < 0.001, NPD vs HFD/RT: p < 0.001; NPD vs HFD/GT: p < 0.001; HFD vs HFD/RT: p < 0.001; HFD vs HFD/GT: p < 0.001; HFD/RT vs HFD/GT: p < 0.01.

