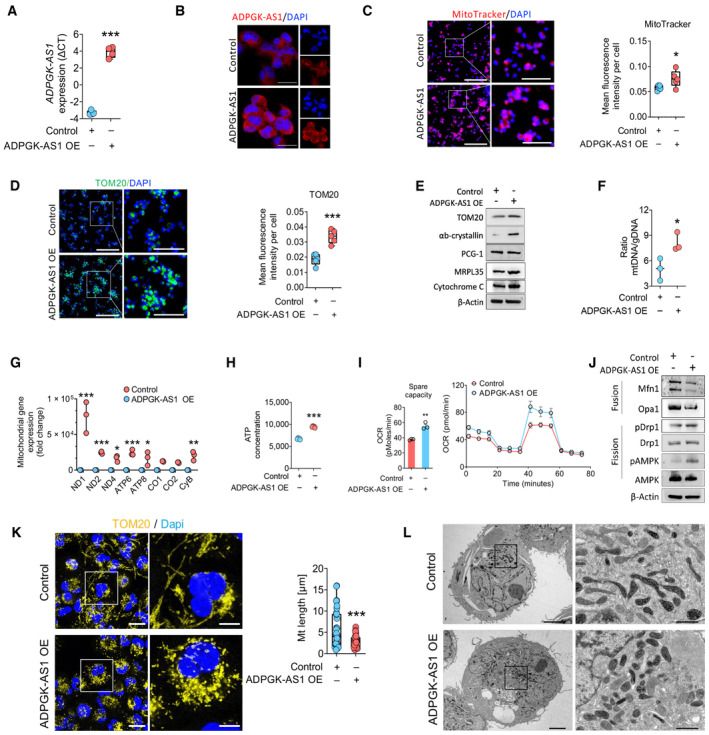
Figure 3. ADPGK‐AS1 overexpression alters the regulation of mitochondrial metabolism.

-
AExpression of ADPGK‐AS1 lncRNA (ΔCT) in ADPGK‐AS1 overexpressing (OE) THP1 cells. n = 4 independent experiments. ***P ≤ 0.001 compared with control.
-
BRepresentative FISH images of ADPGK‐AS1 (red) and nuclei (blue) in ADPGK‐AS1 OE THP1 cells. Scale bar = 25 μm.
-
C, DRepresentative images and quantification of mitochondria by MitoTracker (red) and TOM20 (green) in THP1 control and ADPGK‐AS1 OE cells. Nuclei were stained with DAPI (blue). Scale bar = 200 μm (left), 100 μm (right, magnification).
-
ERepresentative immunoblot for mitochondrial protein expression (TOM20, αb‐crystallin, PCG‐1, MRPL15, MRPL35, cytochrome C) in THP1 control and ADPGK‐AS1 OE cells. n = 4 independent experiments.
-
FRatio of mitochondrial DNA (mtDNA) to genomic DNA (gDNA) content in THP1 control and ADPGK‐AS1 OE cells. n = 3 independent experiments. *P ≤ 0.05 compared with control.
-
GGene expression analysis (fold change) of mitochondrially encoded genes (ND1, ND2, ND4, ATP6, ATP8, CO1, CO2, CyB) after isolation of mtDNA from THP1 control and ADPGK‐AS1 OE cells. n = 3 independent experiments. *P ≤ 0.05, **P ≤ 0.01, ***P ≤ 0.001 compared with control.
-
H, IATP production (n = 5) and full oxygen consumption plot (n = 8) by the seahorse assay in THP1 control and ADPGK‐AS1 OE cells. **P ≤ 0.01, ***P ≤ 0.001 compared with control.
-
JRepresentative immunoblot of proteins involved in fission and fusion processes of mitochondria (Mfn1, Opa1, Drp1, pAMPK, AMPK). n = 4 independent experiments.
-
KRepresentative confocal fluorescence images and quantification of mitochondrial shape with the mitochondrial marker TOM20 (yellow) in THP1 control and ADPGK‐AS1 OE cells. Nuclei were stained with DAPI (blue). n = 35 cells, Scale bar = 10 μm (left), 5 μm (magnification, right).
-
LTransmission electron microscopy images of mitochondrial shapes in THP1 control and ADPGK‐AS1 OE cells. n = 4 cells, Scale bar = 5 μm (left), 1 μm (right, magnification).
Source data are available online for this figure.
