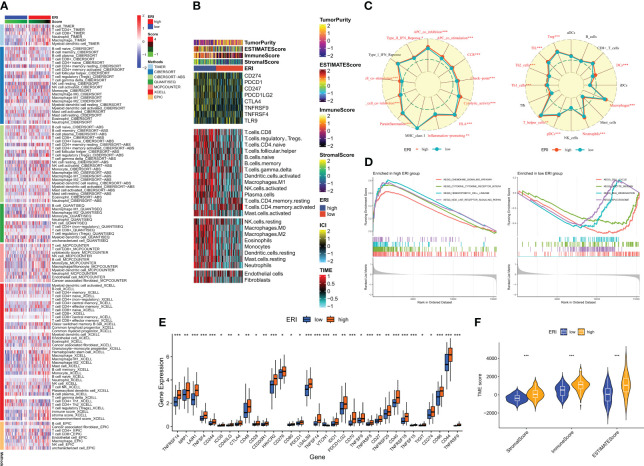
Figure 7.
Immune microenvironment analysis of different ERI subgroups. (A) Differences in immune infiltration in different ERI subgroups were assessed using seven algorithms. (B) Heat map illustrating the differences in TME scores, immune checkpoint expression, and immune cell infiltration in different ERI subgroups (based on ssGSEA). (C) Radar plot illustrating the differences in immune cell infiltration and immune-related pathways calculated by ssGSEA between patients in different ERI subgroups. (D) GSEA analysis of the high-ERI and low-ERI groups focusing on the different enrichment of the KEGG pathway. (E) Differences in immune checkpoint expression between different ERI subgroups. (F) Differences in TME scores between patients in different ERI subgroups. * P<0.05, ** P<0.01, *** P<0.001.

