Figure 9.
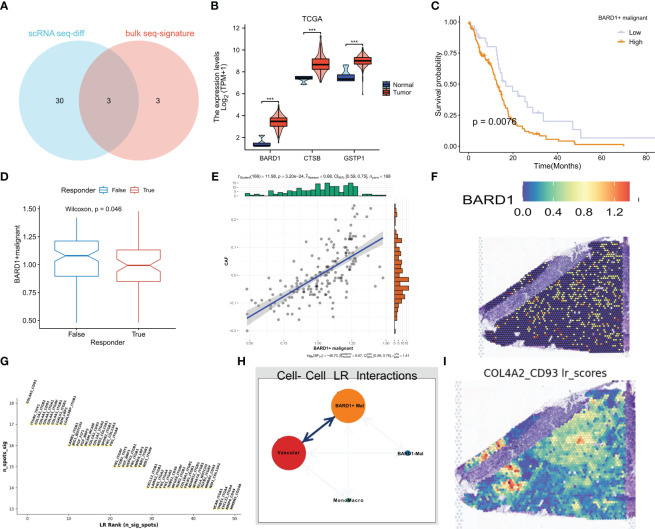
BARD1 is a marker of poor prognosis in GBM patients. (A) Three genes common to exosome-related and model genes were obtained by differential analysis in single-cell sequencing. (B) Expression of three genes in the TCGA cohort. (C) Kaplan-Meier survival curves for OS of patients in the high and low BARD1+ malignant cell expression groups. (D) Prediction of response to immunotherapy by TIDE based on the proportion of BARD1+ malignant cells. (E) Correlation between the proportion of BARD1+ malignant cells and CAF cell content. (F) Spatial map of BARD1 expression. (G) Interacting ligand-receptor pairs of top50. (H) Ligand-receptor communication of different cell types in space. (I) The spatial plot of COL4A2-CD93 ligand-receptor pair scores. *** p< 0.001.

