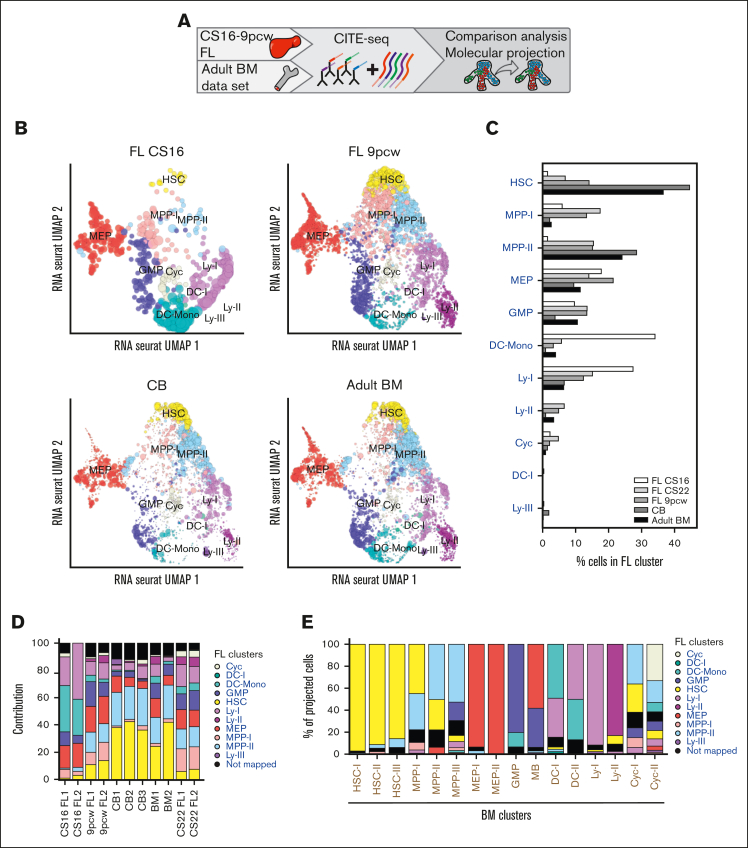
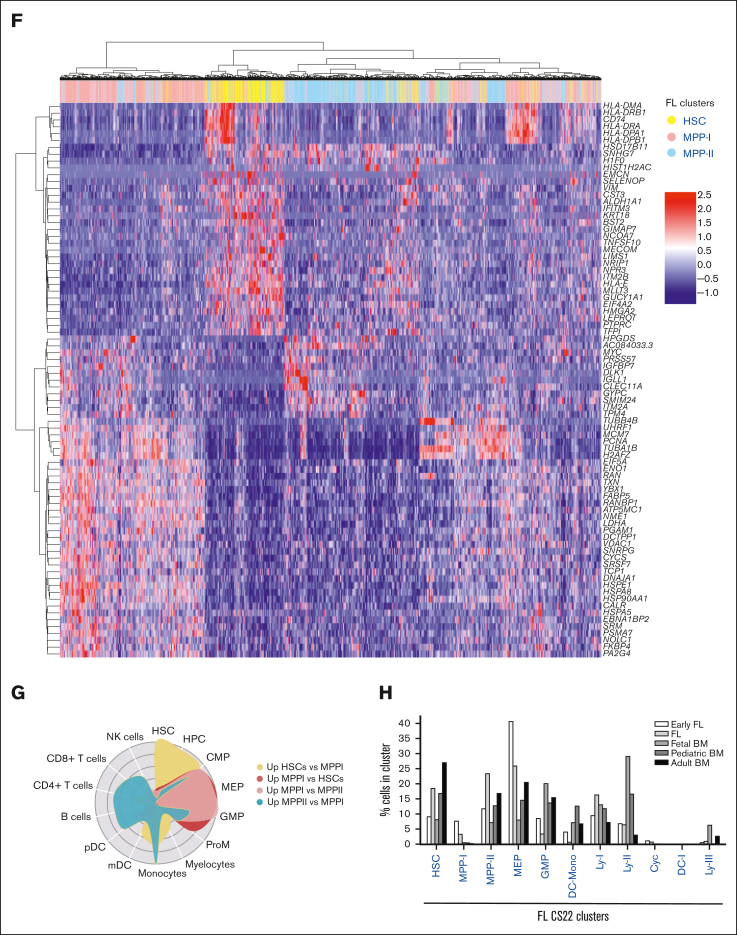
Figure 3.
Projection analysis defines a fetal-specific multipotent cluster with erythromyeloid signature. (A) Schematic presentation of data in the figure. (B) Projection of FL CS16, FL 9pcw, CB, and adult BM on the FL CS22 UMAP, size of dots represents mapping-score and color of dots represents FL-derived clusters as in Figure 1B. (C) Quantification of projected cells (Figure 3B) in all mapped developmental stages (FL CS16: 143 cells, FL CS22: 6732 cells, FL 9pcw: 1139 cells, CB: 6984 cells, adult BM: 4905 cells). (D) Contribution (percent) of individual donors to the mapping in Figure 3B-C. (E) Classification of adult BM-derived clusters (x-axis) on FL CS22 (also refer to supplemental Figure 3A). (F) Hierarchical clustering of DEGs in primitive CS22 FL cell populations (HSC, MPP-I, and MPP-II). (G) CellRadar plots of DEGs between HSC, MPP-I, and MPP-II. (H) Quantification of classified cells in all mapped developmental stages from Roy et al.6 In total, 90% to 95% of the cell from the different stages mapped. (Early FL; first trimester, FL, and fetal BM; second trimester).


