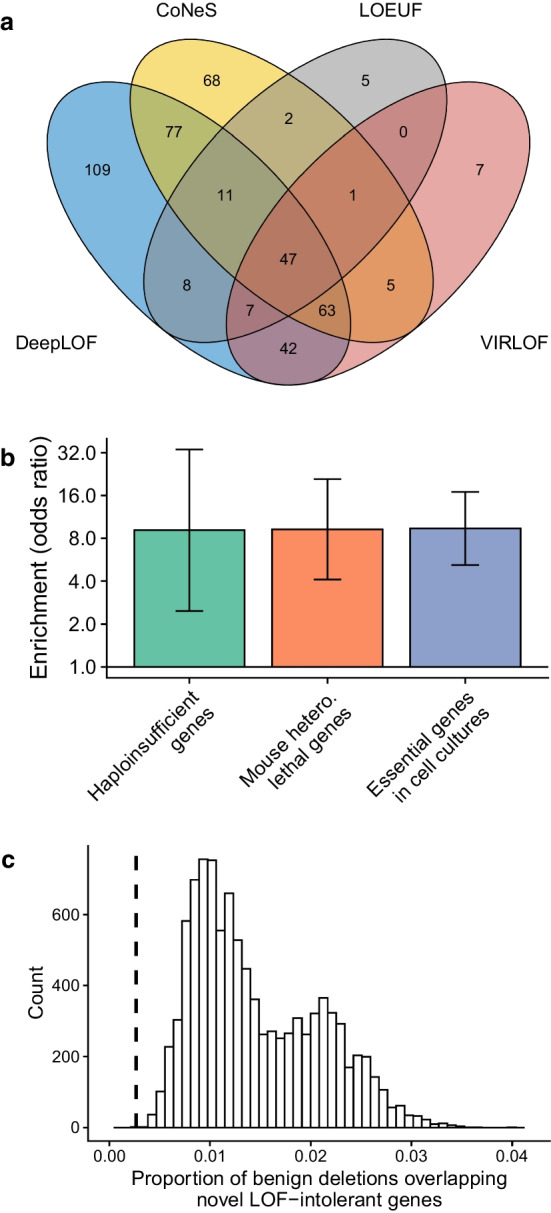
Fig. 5.

Predicted LOF-intolerant genes with expected LOF variants. a Venn diagram of predicted LOF-intolerant genes. b Enrichment of essential genes in the 109 LOF-intolerant genes uniquely predicted by DeepLOF. Error bars represent 95% confidence intervals. c Proportion of benign genomic deletions overlapping the 109 LOF-intolerant genes uniquely predicted by DeepLOF. The histogram represents the null distribution of the proportion from a permutation test, and the dashed vertical line represents the observed proportion in empirical data
