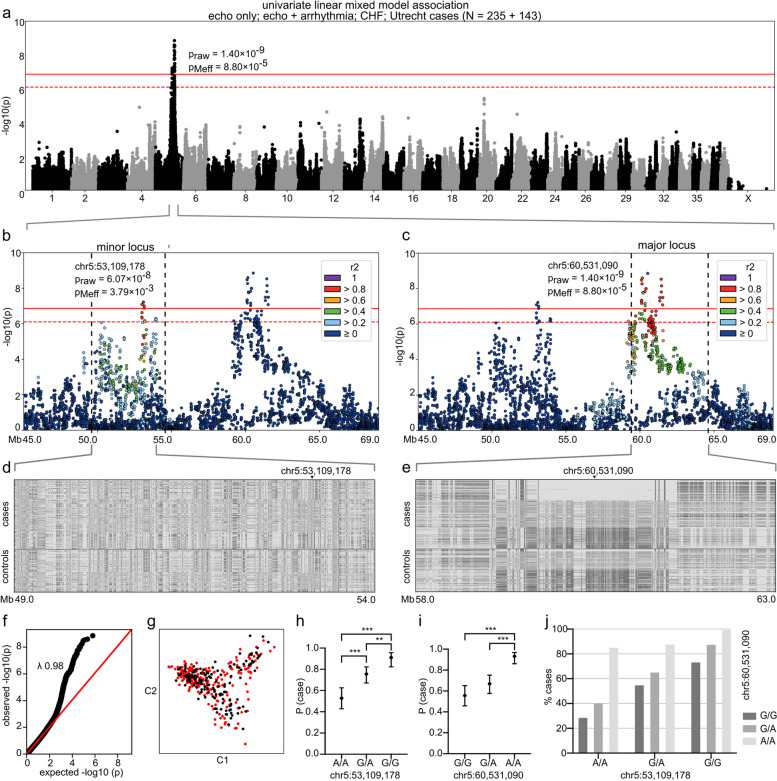
Fig. 1.
GWAS with a univariate linear mixed model. The analysis included 235 cases from the “echo only,” “echo + arrhythmia,” and “CHF” subcohorts and Utrecht cohort and 143 controls from the “healthy” subcohort. In a–c, Bonferroni-corrected and Meff significance thresholds are indicated with solid and dashed red lines, respectively. In d and e, the colors indicate the homozygous genotype for the case major allele (light gray), heterozygous genotype (middle gray), and homozygous genotype for the case minor allele (dark gray). In h and i, error bars indicate 95% confidence limits and asterisks ** and *** p-values < 0.01 and < 0.001, respectively. a A genome-wide significant two-locus signal occurs on chromosome 5: the major locus resides at 60 Mb and the minor locus at 53 Mb. The most significant SNP (praw = 1.40 × 10⁻⁹, pMeff = 8.80 × 10⁻⁵) is located at chr5:60,531,090. b A locus plot of chr5:45.0–69.0 Mb and SNP correlation structure of the index SNP chr5:53,109,178. c A locus plot of chr5:45.0–69.0 Mb and SNP correlation structure of the index SNP chr5:60,531,090. d Genotype plot of chr5:59–54 Mb. e Genotype plot of chr5:58–63 Mb. f Q-Q plot of the p-values (likelihood ratio test). g A multi-dimensional scaling (MDS) plot of the cases (red) and controls (black). h Probability of case status (P (case)) by genotype at chr5:53,109,178 (N = 372). i Probability of case status (P (case)) by genotype at chr5:60,531,090 (N = 372). j Frequency of case status by joint genotypes at ch5:53,109,178 and chr5:60,531,090 (N = 372)

