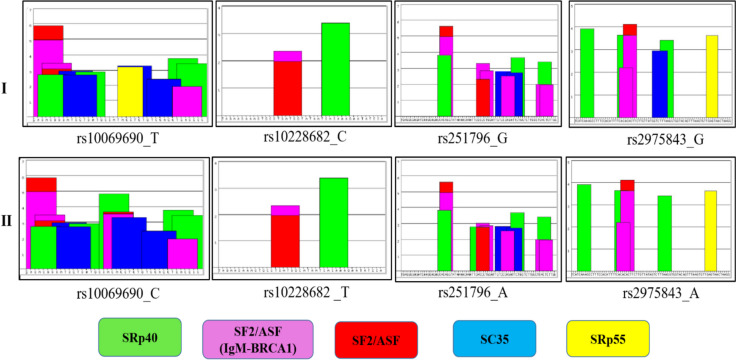
Fig. 2.
Effect of genetic variation on the Exonic Splicing Enhancers (ESEs) according to the ESE prediction tool. ESE finder enables the recognition of potential ESE sites. The elevation of the colored bars represents the motif scores, and the bars' circumference indicates the motif's length. Bars in red, yellow, blue, purple, and green indicate potential binding sites for Serine-Arginine (SR) proteins SF2/ASF, SRp55, SC35, SF2/ASF (IgM-BRCA1) and SRp40, respectively. Panel-I signifies the ESE sequence with the allele not posing a risk in the population under study, and panel –II denotes the ESE sequence with the risk allele in the studied population

