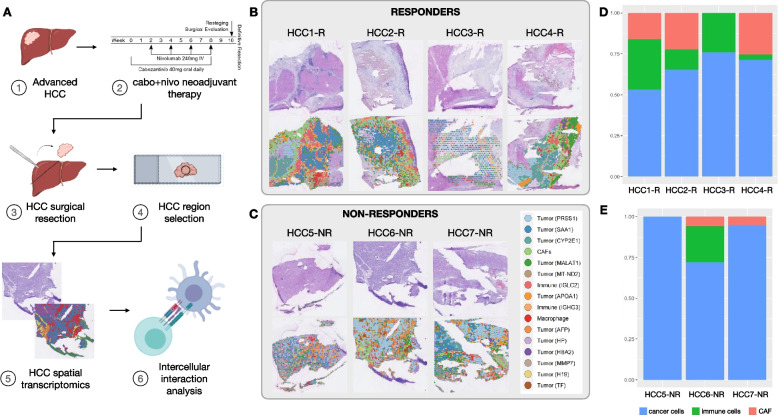
Fig. 1.
Spatial transcriptomics analysis of HCC samples treated with cabozantinib and nivolumab. A Experimental workflow. B Hematoxylin and eosin (H&E)-stained images of the samples profiled and the spatial clusters for responders. C H&E and spatial clusters for non-responders. D Tumor-, immune-, and cancer-associated fibroblast (CAF) composition in each responder sample as determined by spatial transcriptomics. E Tumor-, immune-, and CAF proportions in non-responders samples. To quantify the cell proportions of tumor, immune, and CAF in each patient, the multiple clusters that were classified as the same type were merged into one major category

