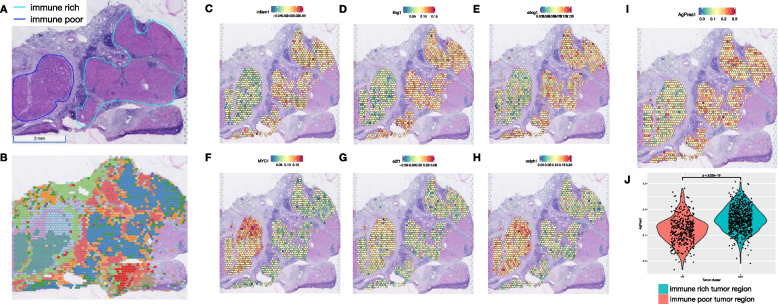
Fig. 4.
Intra-sample heterogeneity analysis with spatial transcriptomics. A Responder sample with remarkable heterogeneity with two tumor regions, one immune-rich (cyan) and one immune-poor (dark blue). B Each of these regions presents distinct transcriptional profiles as determined by clustering analysis. C–E The immune-rich tumor region highly expresses immune-related pathways that were initially observed to be enriched across responders’ samples. F–H Proliferation and metabolic pathways, which are enriched across non-responders’ tumors, are expressed in high levels at the immune-poor region. I-J The immune-rich tumor region expresses high levels of the antigen processing and presentation machinery genes, which is associated with the more efficient attraction of immune cells

