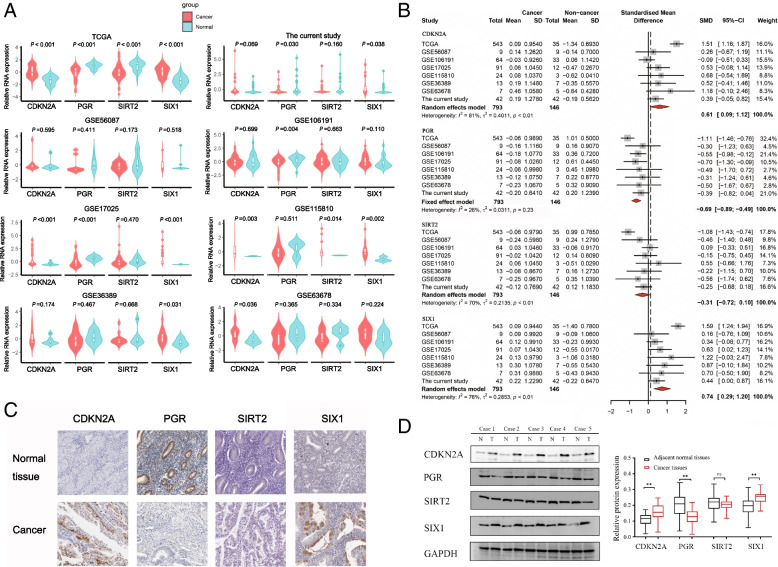
Fig. 3.
SIRT2, SIX1, CDKN2A and PGR expression in EC tissues. A Four EMT-related genes expression in TCGA dataset, current study and 6 GEO datasets. The gene expression was normalized by “scale” function in R. B Comparisons of four EMT-related genes expression between EC and normal tissues evaluated by forest-plot based on data from TCGA dataset, current study and 6 GEO datasets. Rhombus indicates the average standardized mean difference (SMD) with 95% confidence intervals. C Four EMT-related genes expression in EC tissue samples and corresponding non-cancer tissue samples from The Human Protein Atlas. D Four EMT-related genes expression in 42 paired EC tissue samples. Representative expression levels of these Four EMT-related genes in several EC patients. N, normal tissues; T, tumor tissue. ** means P < 0.01; ns means P > 0.05

