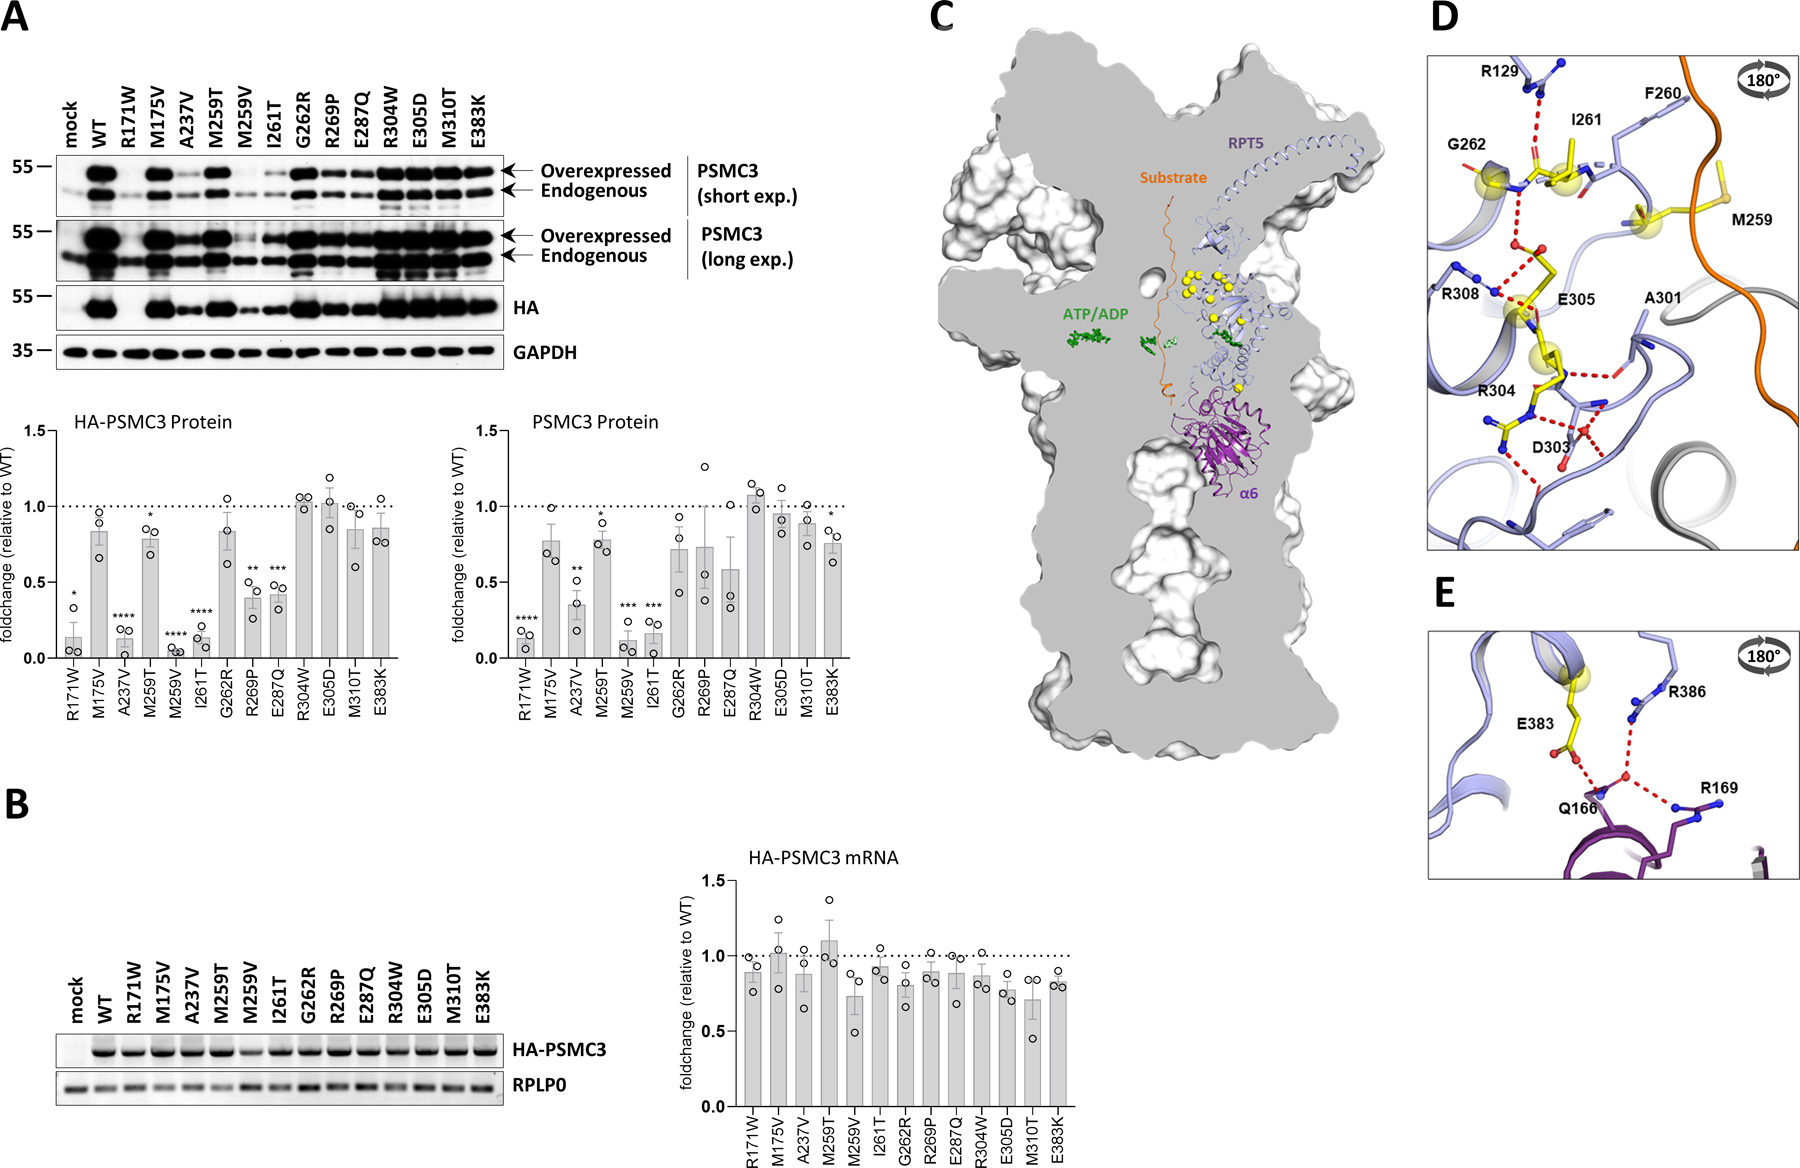
Fig. 3: PSMC3/Rpt5 protein variants do not behave similarly at the molecular level.

A. Top: SHSY5Y cells were transfected with HA-tagged PSMC3 mutants for 24 h before protein extraction and Western-blotting using antibodies specific for PSMC3/Rpt5 and HA, as indicated. Non-transfected and mock-transfected cells served as negative controls. Equal protein loading was ensured by probing the membranes with an anti-α-tubulin monoclonal antibody (two exposure times are shown). Arrows indicate overexpressed and endogenous PSMC3/Rpt5. Shown is one representative experiment out of three. Bottom: quantification of HA-tagged and untagged PSMC3/Rpt5 proteins in transfected SHSY5Y cells by densitometry. Data are presented as protein foldchanges to wild-type (WT) PSMC3/Rpt5 proteins whose densitometry measurements were set to 1 (gridline) after normalization with GAPDH. Shown are mean values ± SEM from three independent experiments. Statistical significance was assessed by unpaired Student’s test (*p<0.05, **p<0.01, ***p<0.001 and ****p<0.0001). B. Left: SHSY5Y cells that were transfected with HA-PSMC3 variants were subjected to total RNA extraction followed by semi-quantitative RT-PCR using primer located in PSMC3 and the polyadenylation signal of the pcDNA3.1/myc-HIS expression vector (BGH). Equal loading between the samples was ensured by amplifying the RPL0 gene, as indicated. Right: quantification of HA-tagged PSMC3 transcripts in transfected SHSY5Y cells by densitometry. Data are presented as mRNA foldchanges to wild-type (WT) HA-PSMC3 mRNA whose densitometry measurements were set to 1 (gridline) after normalization with RPLP0. Shown are mean values ± SEM from three independent experiments. C. A sliced surface view of the 26S proteasome (grey) was superimposed with a cartoon representation of the subunit PSMC3/RPT5 (blue) and PSMB1/α6 (purple) as well as the substrate (orange). The ATP/ADP molecules of the AAA-ATPase ring are shown as green sticks, while the positions of the investigated missense variants are indicated as bright yellow spheres. D. Detailed representation of the missense variants in the loop region of the N-terminal α/β domain. The residues affected by these variants are involved in a polar interaction network close to the substrate tunnel (view rotated by 180° around the x-axis). E. Close up view on the RPT5-α6 interface affected by the E383L variant. Residues affected by this variant are shown as bright yellow balls and sticks with atoms coloured by polarity (oxygen in red, nitrogen in blue and sulphur in dark yellow, view rotated by 180° around the x-axis).
