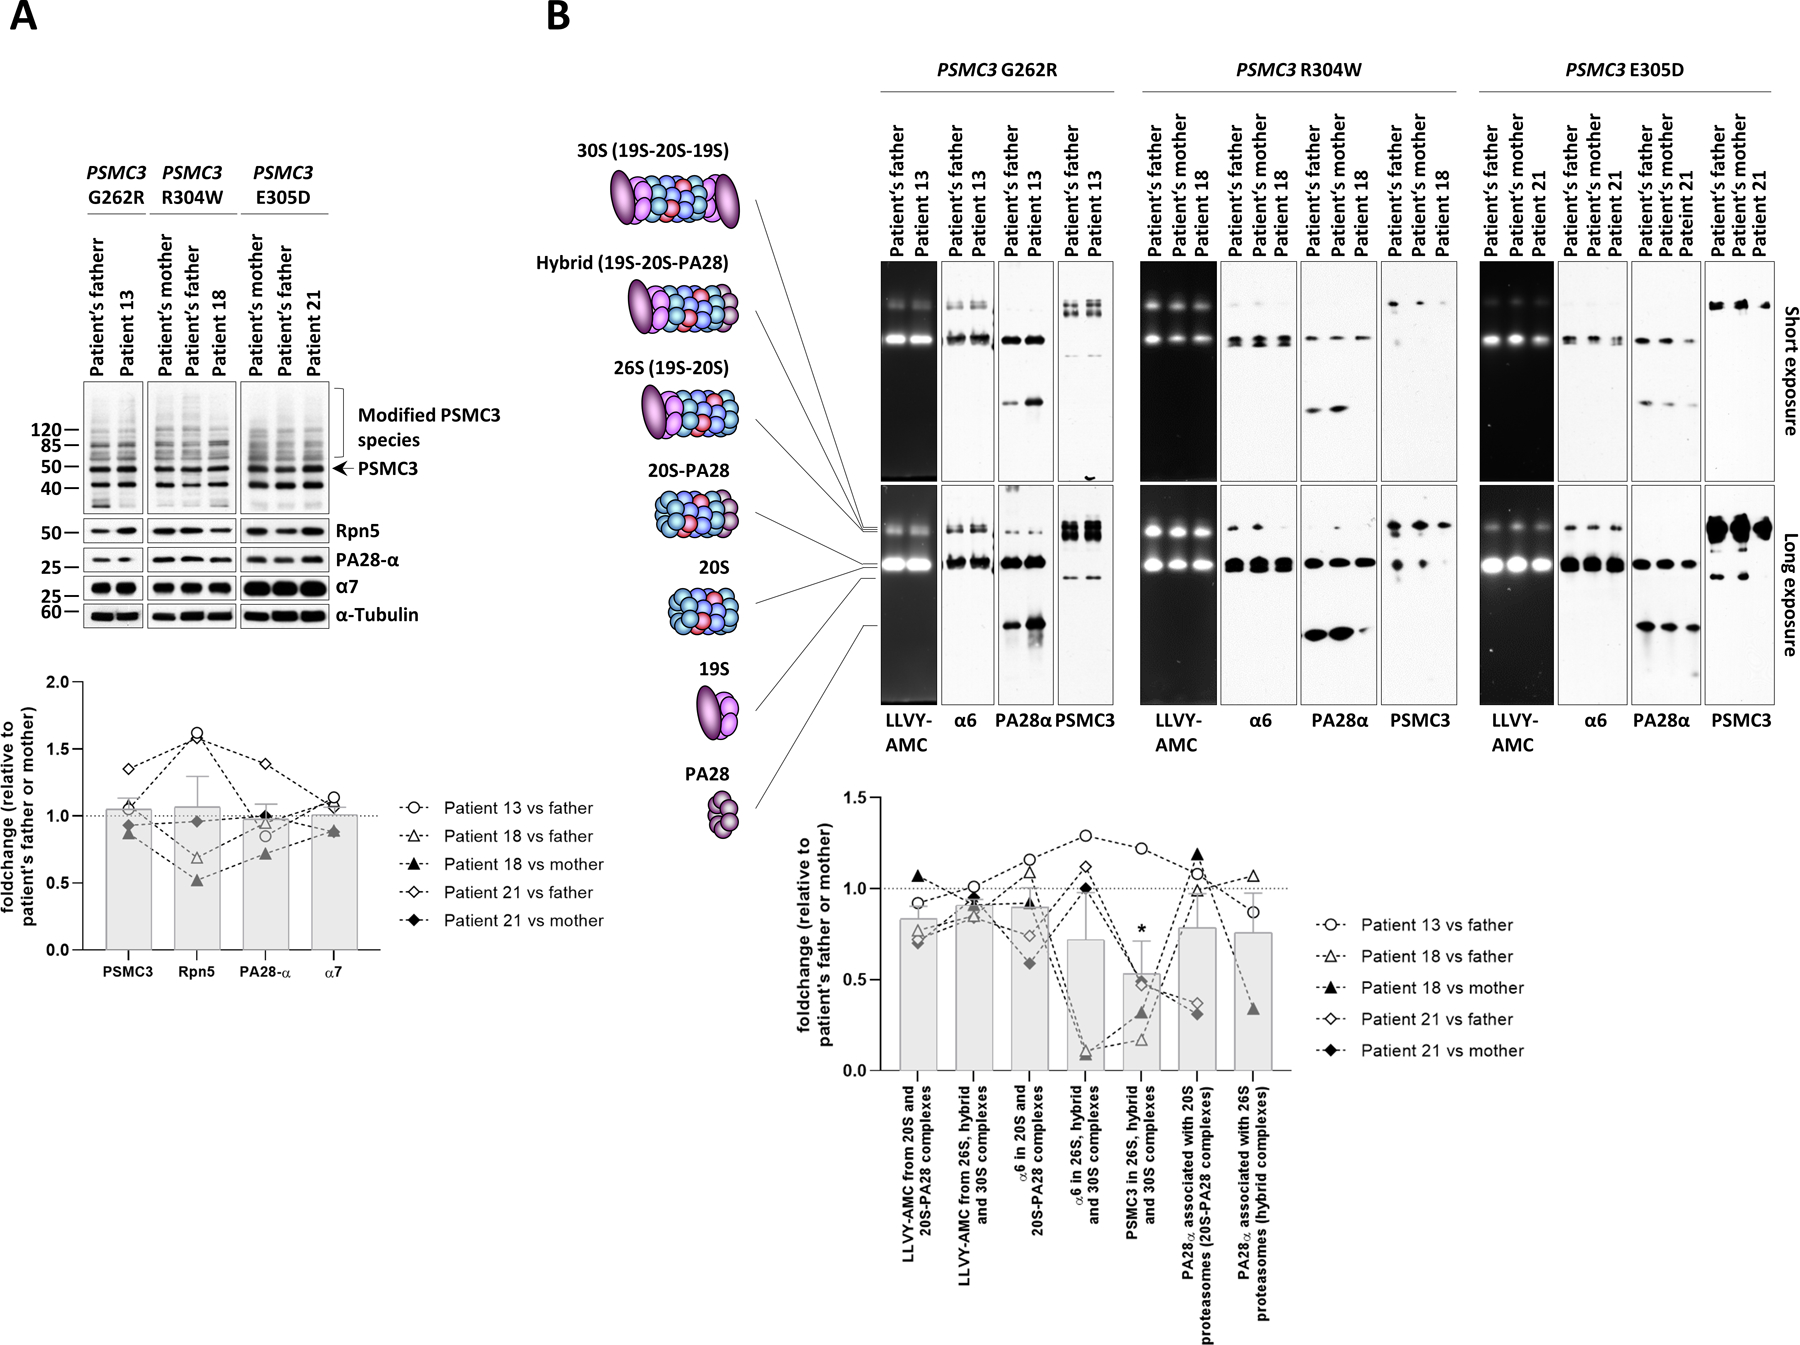
Fig. 4: PSMC3/Rpt5 protein variants lead to proteasome assembly defects in patient T cells.

A. Top: five to twenty micrograms of radio-immunoprecipitation assay (RIPA) lysates from T cells isolated from Patients #13, #18 and #21 as well as related controls (index case’s father and/or mother) were separated by SDS-PAGE followed by Western-blotting using antibodies directed against PSMC3/Rpt5, PSMD12/Rpn5, PA28-α and α7, as indicated. Equal protein loading was ensured by probing the membrane with an anti-α-tubulin antibody. Arrow indicates full-length PSMC3/Rpt5 migrating at the predicted size of about 50 kDa. High molecular weight (HMW) modified PSMC3/Rpt5 species are marked by a bracket. Bottom: quantification of the Western blots by densitometry. Data are presented as foldchanges in Patients #13, #18 and #21 vs their father, mother or both, whose densitometric measurements were set to 1 (gridline), as indicated. Columns indicate the foldchange mean values ± SEM calculated from the five normalizations. B. Top: twenty micrograms of T-cell lysates from patients #13, #18 and #21 and their parents (mother and/or father) were separated by 3–12% native-PAGE. Proteasome chymotrypsin-like activity was assessed in gels using the LLVY-AMC fluorogenic peptide, as indicated. Gels were subsequently subjected to Western-blotting using antibodies specific for α6, PSMC3/Rpt5 and PA28-α, as indicated. The schematic to the left depicts the proteasome complexes (30S, hybrid, 26S, 20S-PA28 and 20S) and free regulators (19S and PA28) detected by the three antibodies. Bottom: quantification of the LLVY-AMC fluorescent signals and α6, PA28α and PSMC3 immunoreactive bands in 20S (short exposure), 20S-PA28 (short exposure), 26S (long exposure), hybrid (long exposure) and/or 30S (long exposure) proteasome complexes by densitometry, as indicated. Data are presented as activity (LLVY-AMC) and protein (α6, PA28α and PSMC3) foldchanges in Patients #13, #18 and #21 vs their father and/or mother whose densitometric measurements were set to 1 (gridline), as indicated. Columns indicate the foldchange mean values ± SEM calculated from the five normalizations. Statistical significance was assessed by unpaired Student’s test (*p<0.05).
