
Fig. 5: Proteomic signatures of patients carrying PSMC3/Rpt5 variants.
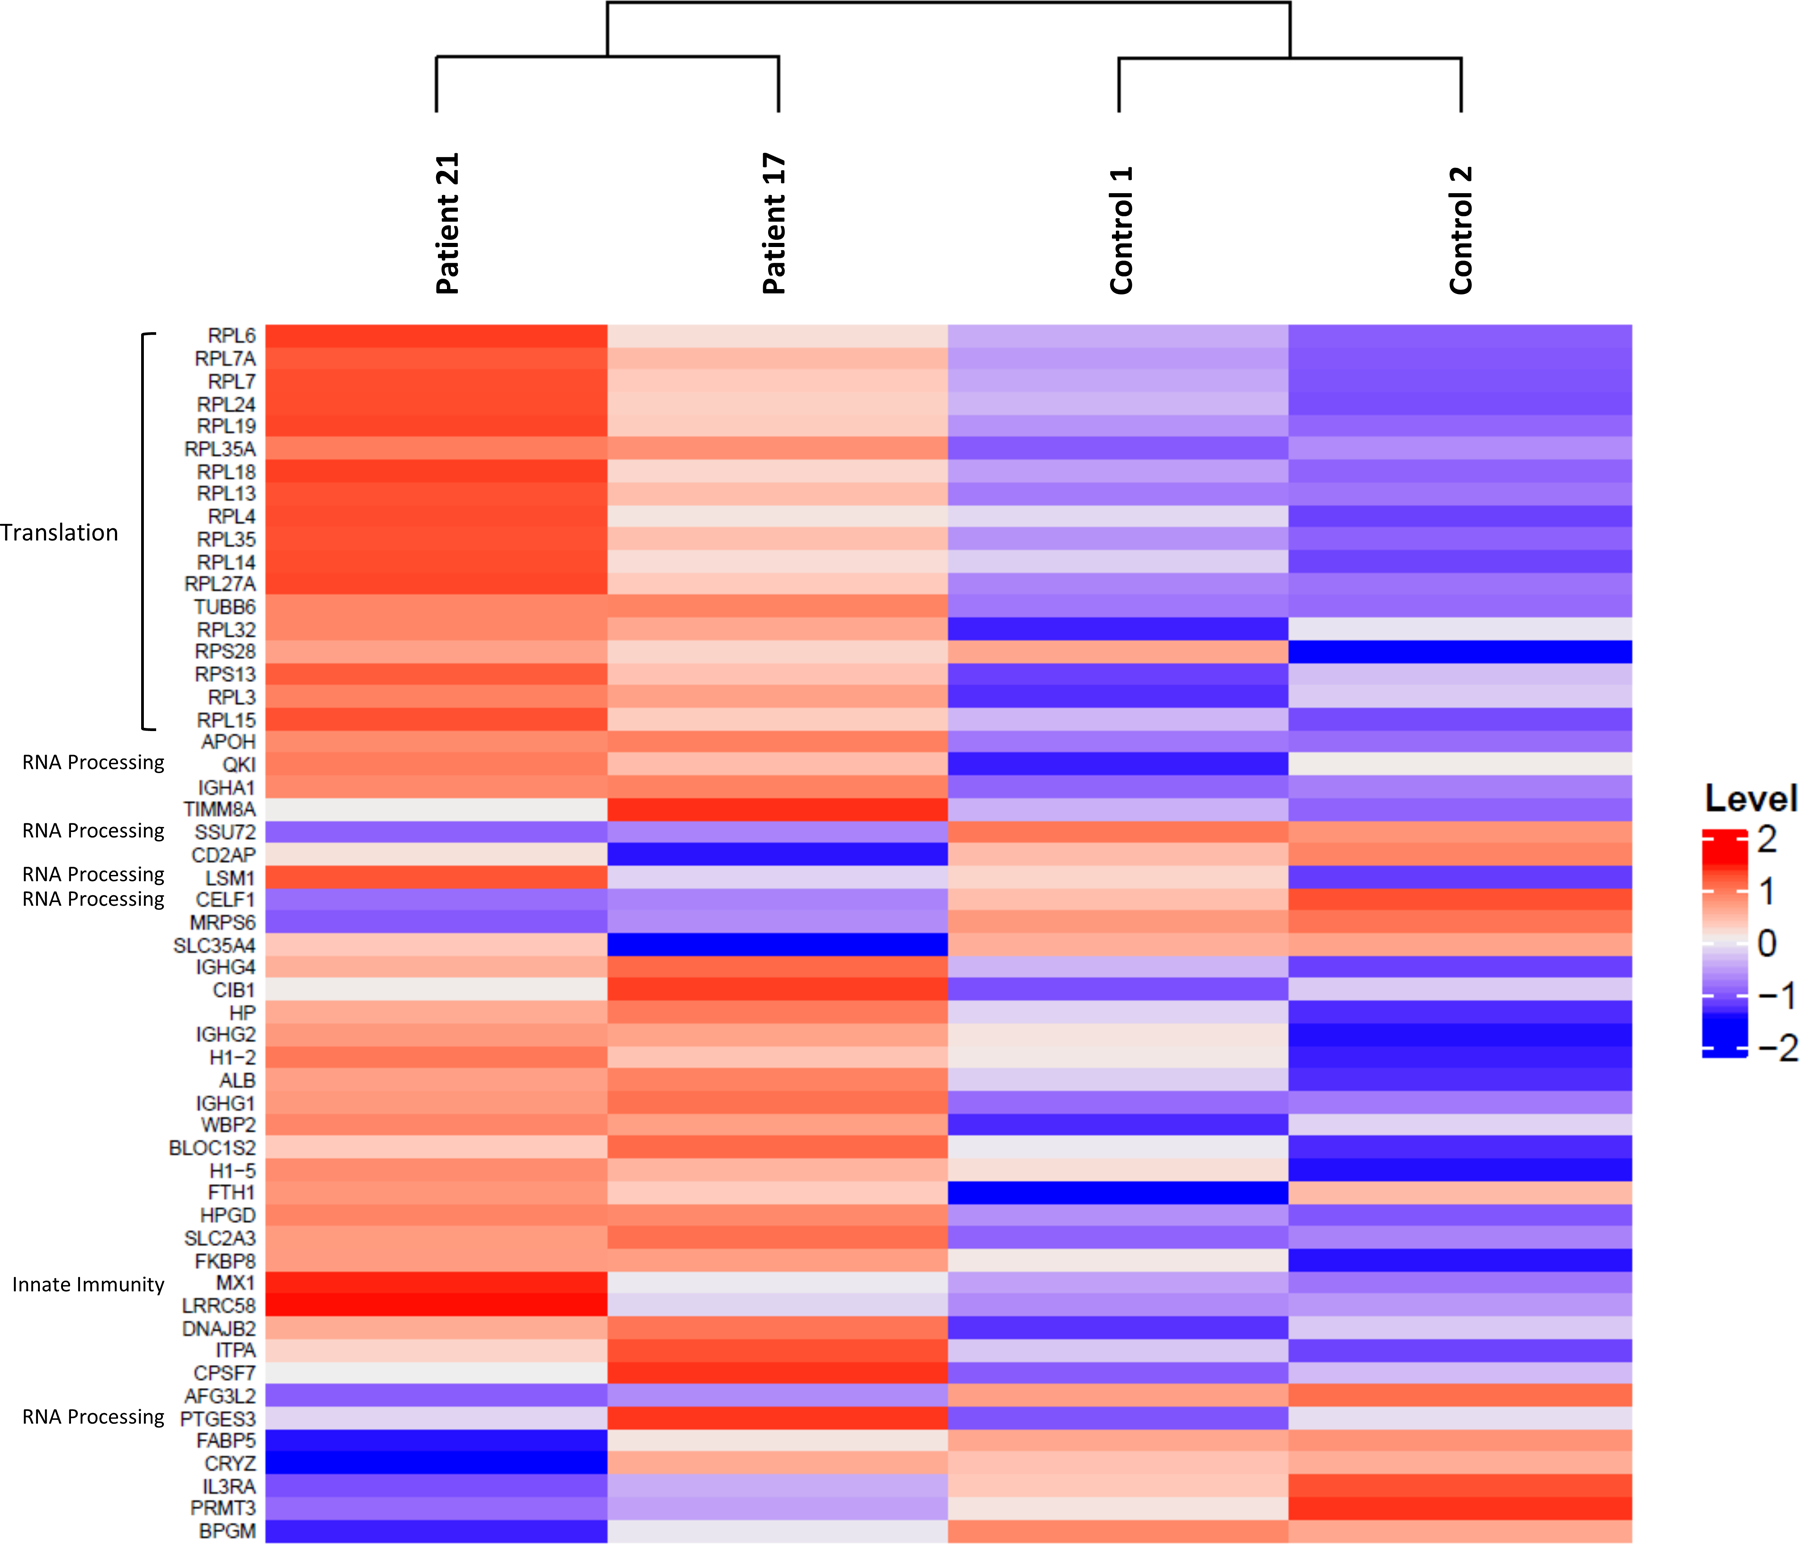
Heatmap cluster analysis showing the similarities in the protein expression profiles of the Patients #17 and #21 (carrying the R304W and E305D PSMC3 variants, respectively) compared to their related controls (father and/or mother of the proband), as indicated. The heatmap indicates the normalized and scale expression value of proteins in the individual samples. Only the differentially expressed proteins with an absolute value of log2 fold-change greater than 2 were selected for the clustering analysis.