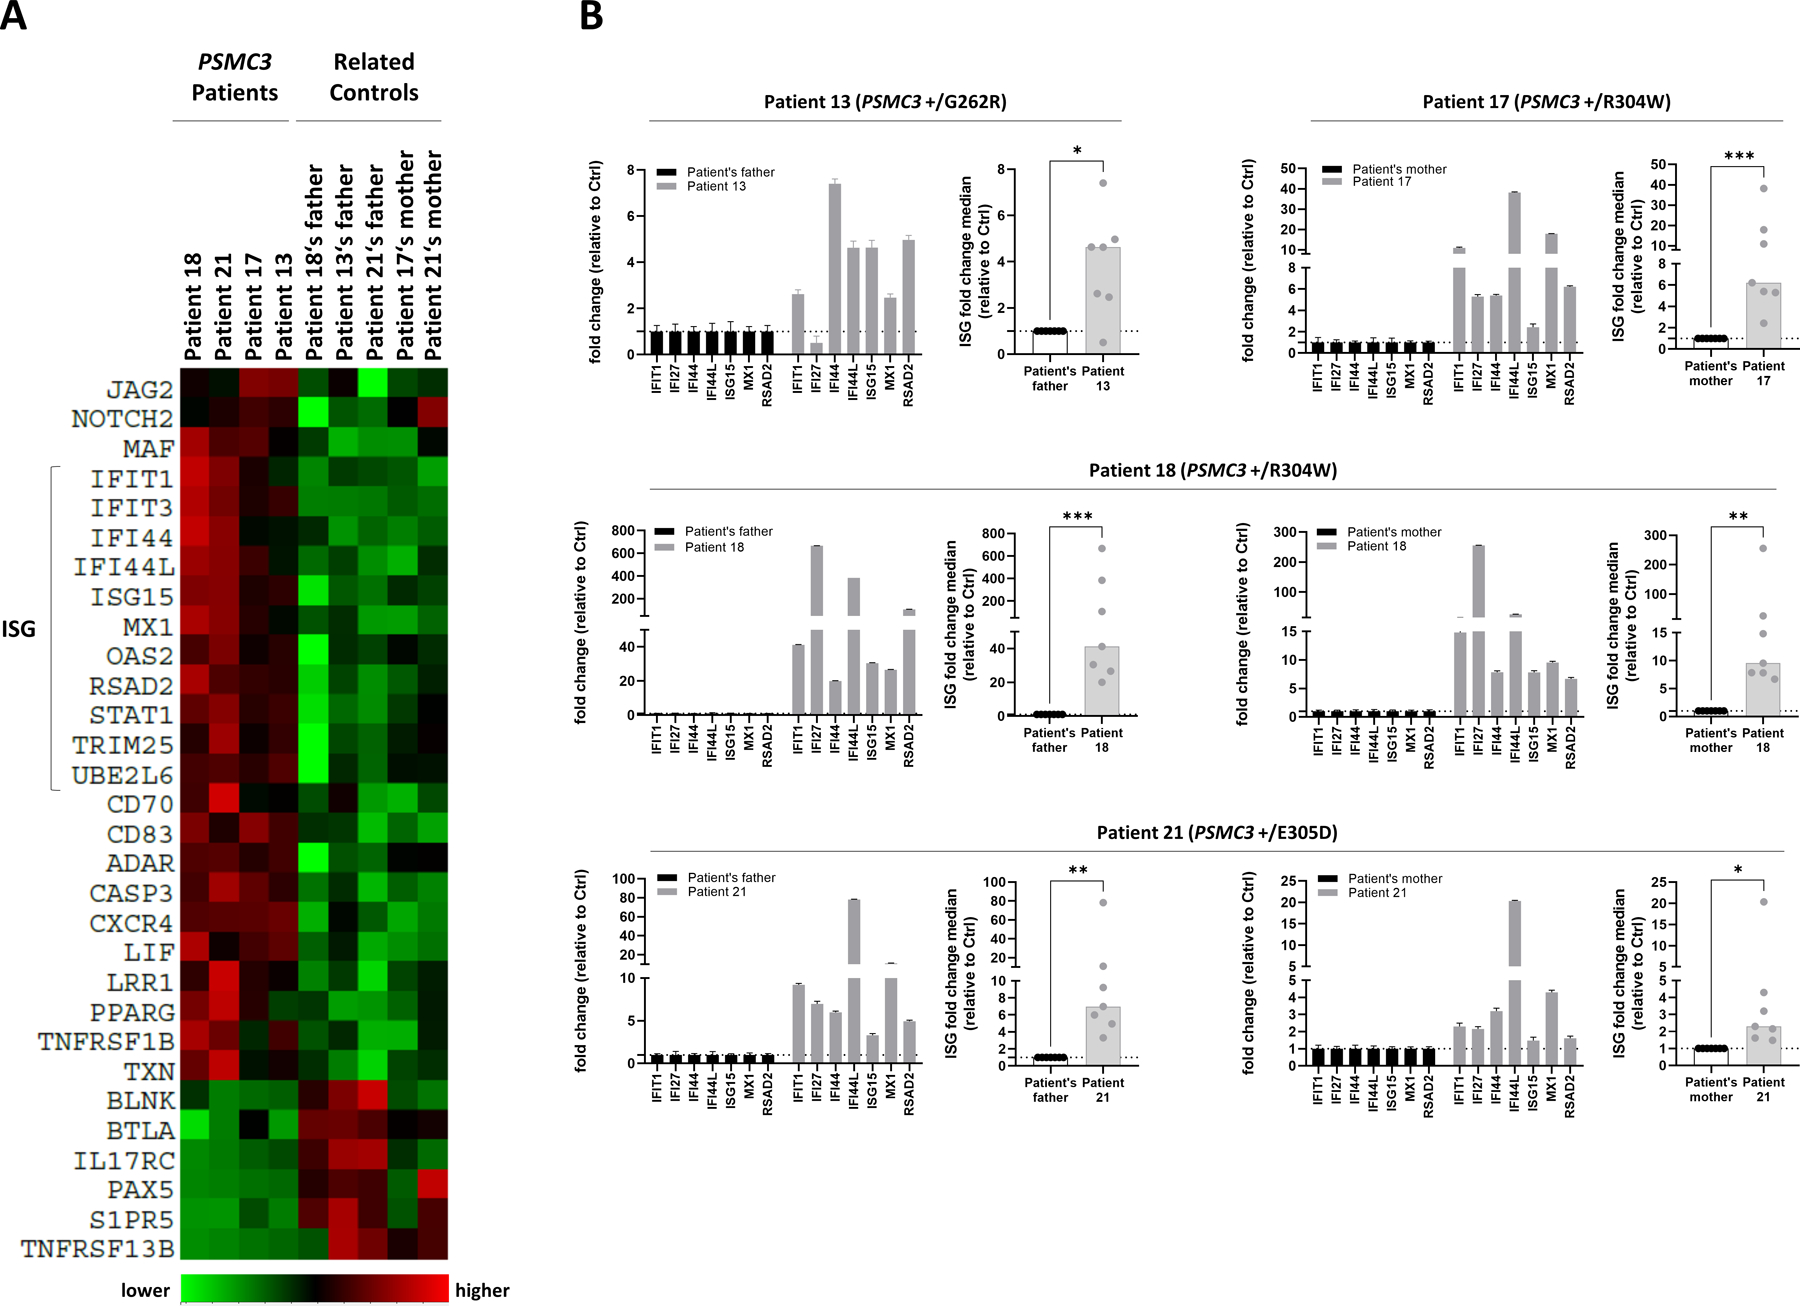
Fig. 7: T cells from patients with PSMC3/Rpt5 missense variants exhibit a typical type I interferon (IFN) signature.

A. Heat map clustering of gene expression in T cells isolated from patients carrying a PSMC3 variant and their relative controls (father and/or mother). Each column represents one individual patient or related control and each row represents one gene. Clustering of genes and samples was carried out by centred Pearson correlation. Colour indicates normalized counts of each transcript, with green representing higher expression and red relatively lower expression. B. Gene expression of seven typical IFN-stimulated genes (IFIT1, IFI27, IFI44, IFI44L, ISG15, MX1 and RSAD2) was assayed by RT-qPCR on T cells derived from Patients #13, #17, #18 and #21 as well as their respective controls (the index case’s father and/or mother). Expression levels were normalized to GAPDH and relative quantifications (RQ) are presented as fold change over controls. Shown is also the median fold expression of the seven ISGs over relative controls. Statistical significance was assessed by ratio paired t test where *indicates p<0.05, ** indicates p<0.01 and *** indicates p<0.001.
