Fig 7.

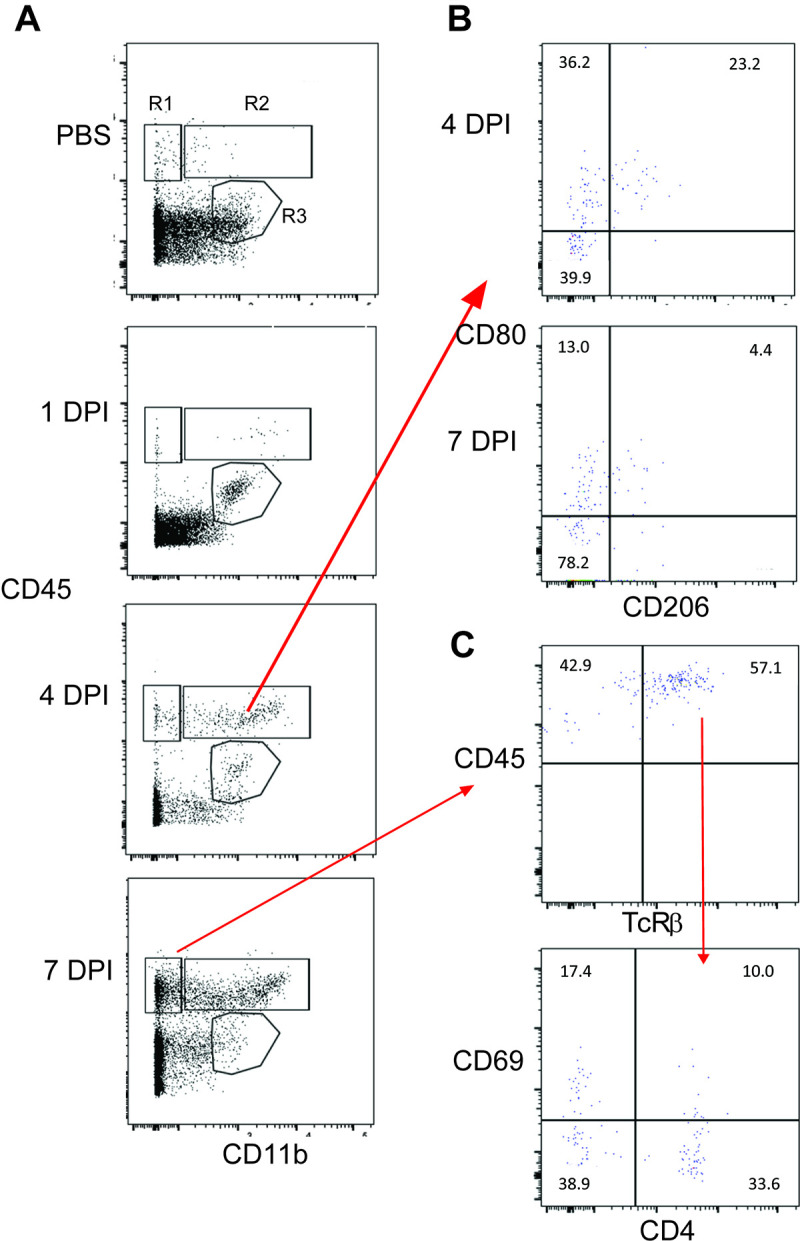
Kinetics of immune cell infiltration in C3H/HeN mouse brains following VEEV TC-83 infection. Cells were isolated from the brains of mice infected with a lethal dose of VEEV TC-83 and sacrificed at 1, 4, and 7 dpi and analyzed by flow cytometry. (A) Representative flow cytometry plots demonstrating the infiltration of immune cells over time based on CD45 and CD11b expression. R1 gate (CD45hi CD11b−) includes lymphocytes, R2 gate (CD45hi CD11b+) includes monocytes and macrophages and the R3 gate (CD45int CD11b+) includes the microglia population. (B) Representative flow cytometry plots demonstrating changes in CD80 and CD206 expression on myeloid cells in R2 gate from 4 to 7 dpi. (C) Representative flow cytometry plot demonstrating increased expression of CD69 on T cells (TcRβ+).
