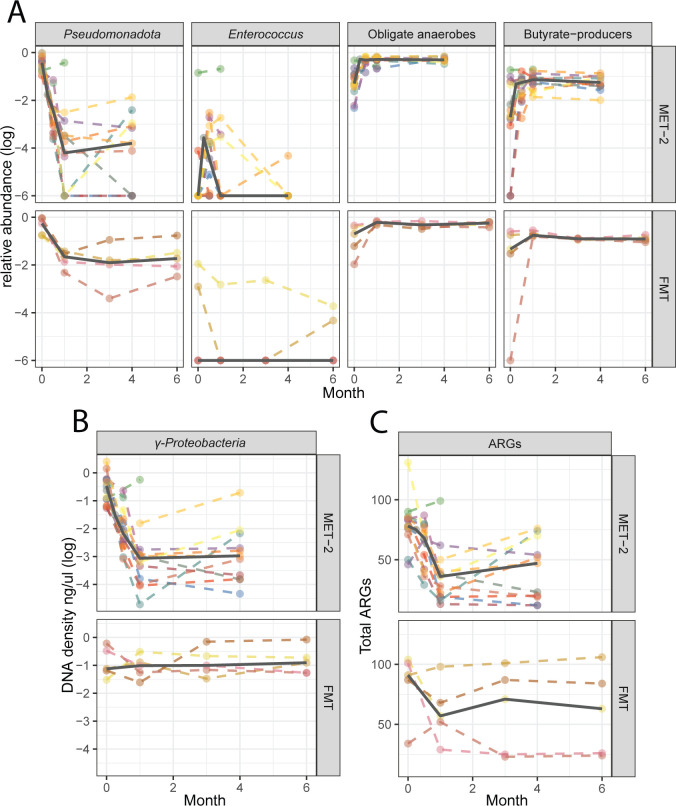
Fig 4.
(A) Relative abundances of Pseudomonadota, Enterococcus, obligate anaerobes, and butyrate producer. (B) γ-Proteobacteria DNA density (ng/μL) and (C) total antimicrobial resistance genes (ARGs) in participants who received MET-2 (n = 15) or FMT (n = 5) measured over time in months. (A and B) Values are log transformed. Dots represent individual participants with dashed lines connecting the same participants measured at different time points. The solid line represents the median across time points.

