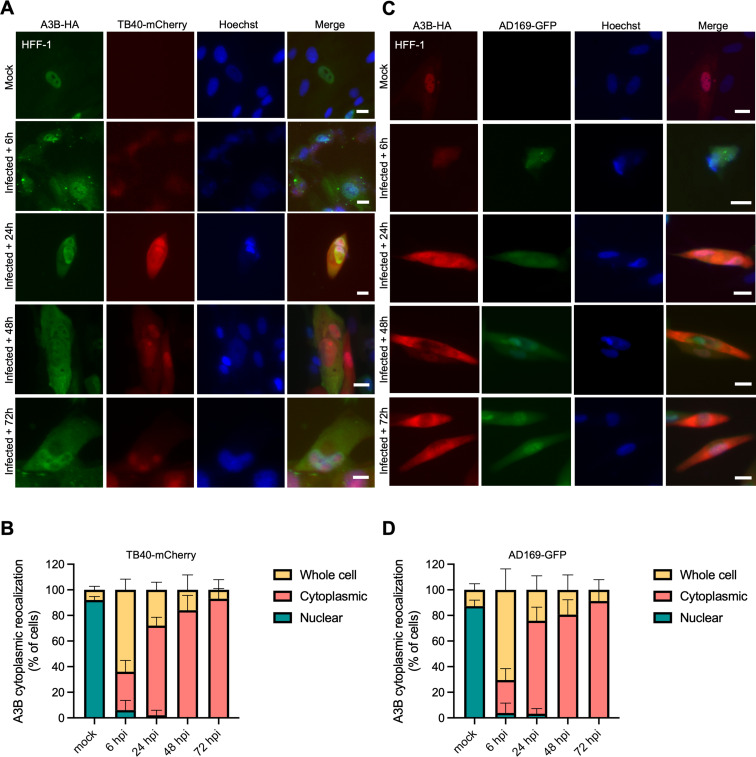
Fig 5.
A3B relocalization occurs early during HCMV infection. (A and C) Representative IF microscopy images of HFF-1 cells stably expressing A3B-HA incubated with medium alone (mock) or infected with the indicated HCMV strains for the indicated timepoints (10 µm scale). (B and D) Quantification of A3B-HA subcellular localization phenotypes shown in panels A and C. Each histogram bar reports the percentage of cells with whole cell, cytoplasmic, and nuclear A3B-HA (n > 100 cells per condition; mean ± SD with P values from unpaired Student’s t-tests).

