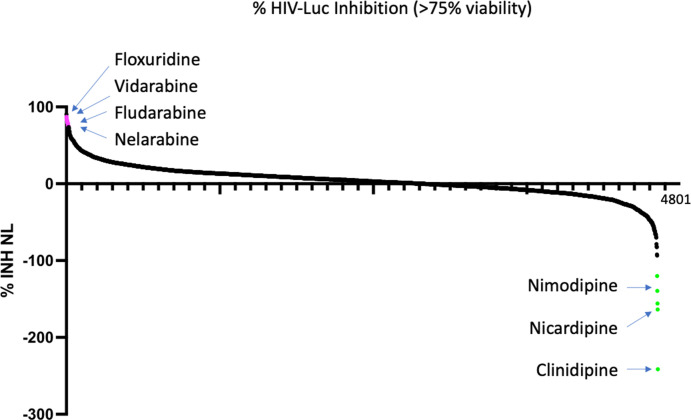
Fig 2.
HTS of compounds. Waterfall plot of the HTS primary screen of 4,800 compounds from the SelleckChem library. Compounds were added at 10 μM, and duplicate plates were analyzed in parallel for nLuc expression from integrated provirus in MDM, and for CellTiter-Glo as an indication of cell viability. Compounds were ranked by percent inhibition of nanoLuc (Y-axis) and filtered for <25% change in CellTiter-Glo.

