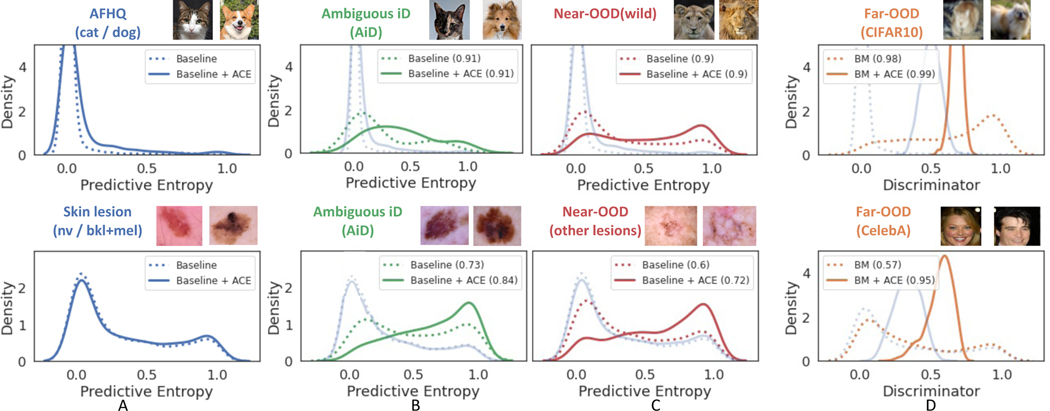
Figure 1.
Comparison of the uncertainty estimates from the baseline, before (dotted line) and after (solid line) fine-tuning with augmentation by counterfactual explanation (ACE). The plots visualize the distribution of predicted entropy (columns A-C) from the classifier and density score from the discriminator (column D). The y-axis of this density plot is the probability density function whose value is meaningful only for relative comparisons between groups, summarized in the legend. A) visualizes the impact of fine-tuning on the in-distribution (iD) samples. A large overlap suggests minimum changes to classification outcome for iD samples. Next columns visualize change in the distribution for ambiguous iD (AiD) (B) and near-OOD samples (C). The peak of the distribution for AiD and near-OOD samples shifted right, thus assigning higher uncertainty and reducing overlap with iD samples. D) compares the density score from discriminator for iD (blue solid) and far-OOD (orange solid) samples. The overlap between the distributions is minimum, resulting in a high AUC-ROC for binary classification over uncertain samples and iD samples. Our method improved the uncertainty estimates across the spectrum.

