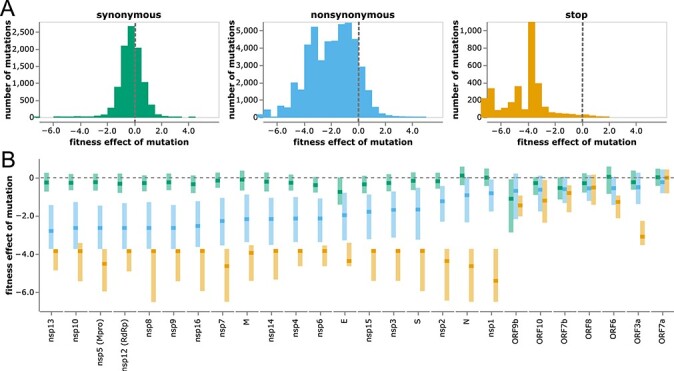
Figure 3.

Distribution of effects of different classes of mutations. (A) Histograms of effects of synonymous, nonsynonymous, and stop-codon mutations across all viral genes. Neutral mutations have effects of zero (dashed gray vertical lines), and deleterious mutations have negative effects. (B) Effects of each class of mutation for each viral gene. Dark squares indicate the median effect, and the lighter rectangles span the interquartile range. Mutation types are color-coded as in panel (A). The apparent constraint on synonymous mutations in ORF9b is probably because this gene is encoded in an overlapping reading frame with N (Jungreis et al. 2021). See https://jbloomlab.github.io/SARS2-mut-fitness/effects_histogram.html and https://jbloomlab.github.io/SARS2-mut-fitness/effects_dist.html for plots that allow adjustment of the expected-count cutoff and other interactive options (such as separate histograms for each gene). See Supplementary Fig. S3 for a version of panel B with genes ordered by genomic position rather than constraint on nonsynonymous mutations.
