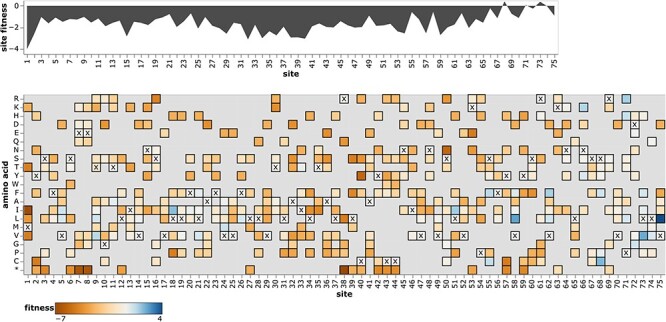
Figure 5.

Effects of amino acid mutations to E protein. The area plot at top shows the average effects of mutations at each site, and the heatmap shows the effects of specific amino acids, with x denoting the amino acid identity in the Wuhan-Hu-1 strain. See https://jbloomlab.github.io/SARS2-mut-fitness/E.html for an interactive version of this plot that enables zooming, mouseovers, adjustment of the minimum expected count threshold, and layering of stop codon effects on the site plot. See https://jbloomlab.github.io/SARS2-mut-fitness for comparable interactive plots for all SARS-CoV-2 proteins.
